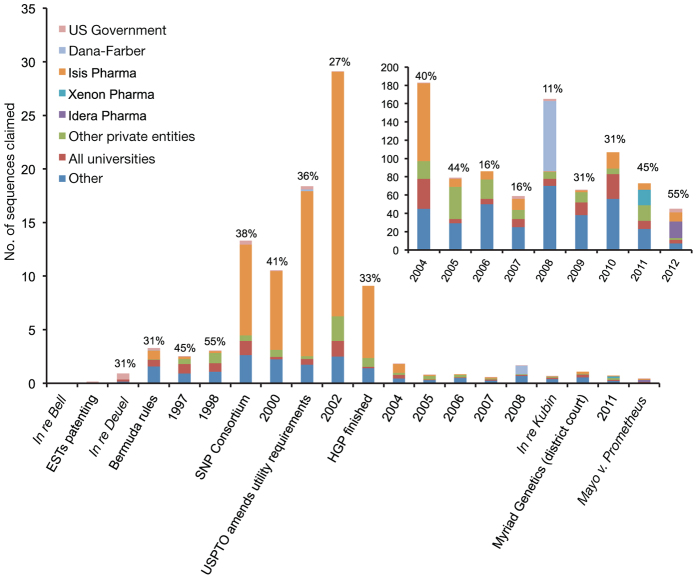
Figure 3. Sequences claimed by applicant and year.
Patent sequences, which were categorized as 'Sequence claimed,' are shown by applicant and by the year in which the patent claiming the sequence was granted by the US Patent and Trademark Office. Some relevant legal and regulatory events affecting the patenting of genetic sequence in the US are also shown across the x-axis, and percent inactive patents per year is also depicted on top of each bar. Patent sequences claimed from 2004–2012 are also shown in the internal chart to allow for differences in scale between the number of claimed sequences before and after 2003.

