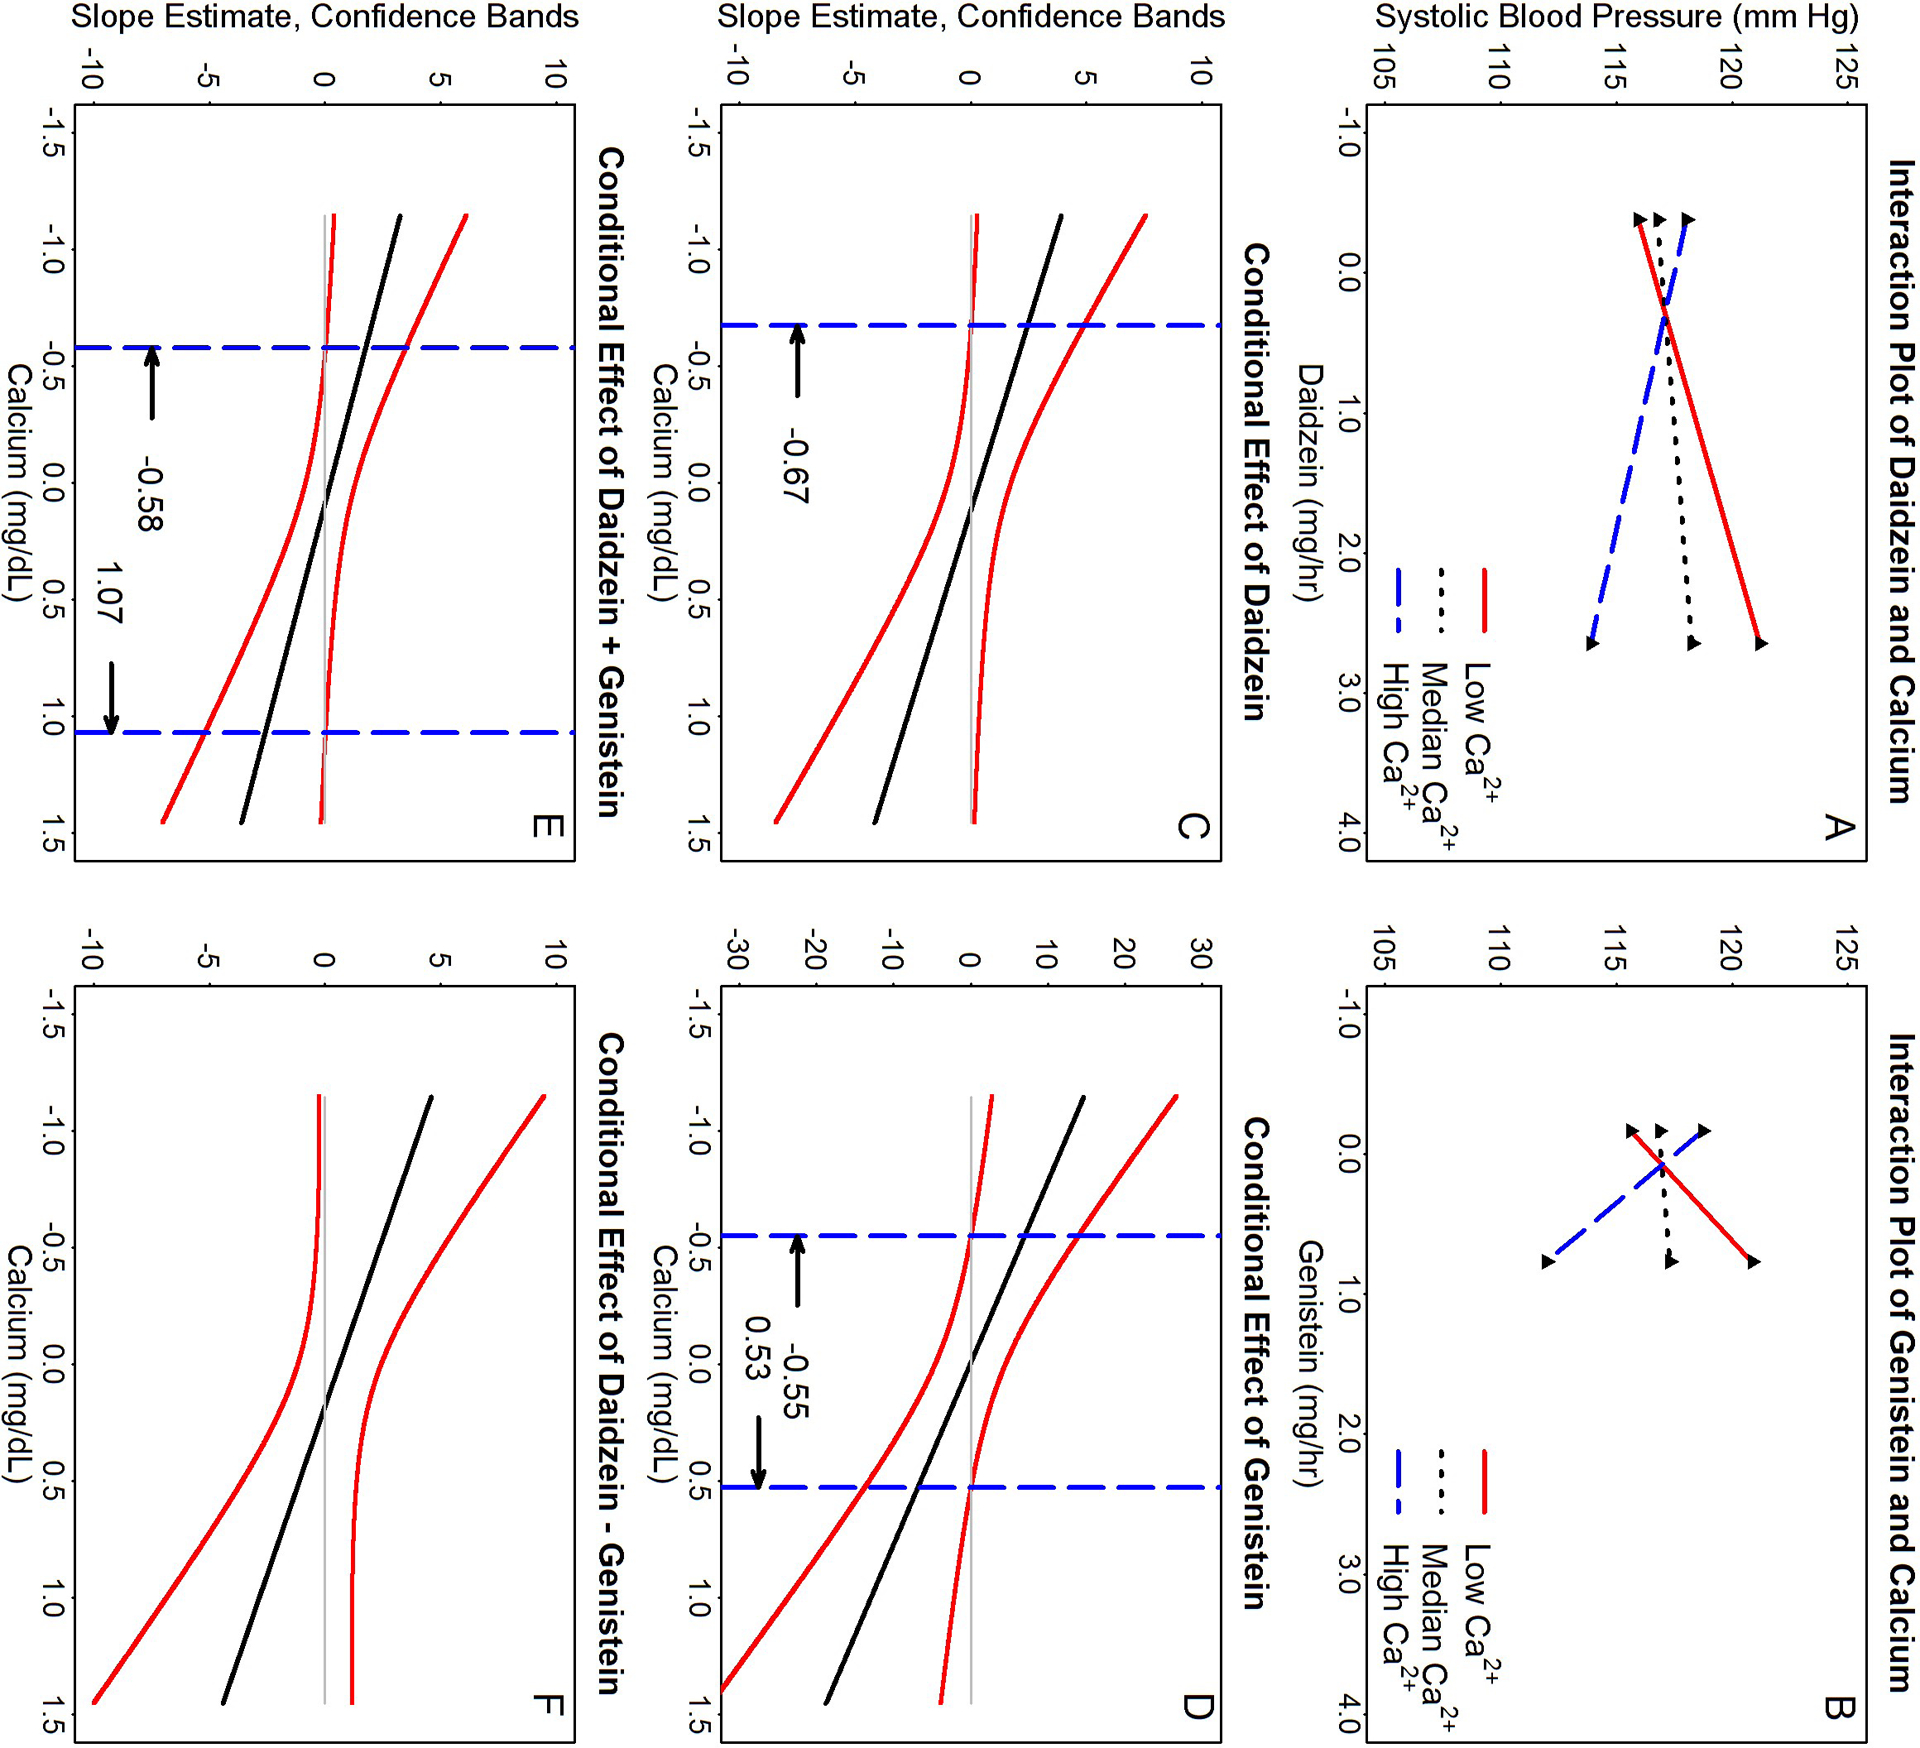
Figure 3:

Probing the interactive effects of isoflavone(s) and calcium on systolic blood pressure (SBP) (using Model 3 of Table 4 as an example) by the Johnson-Neyman technique [35]. Panels A-B are plots of simple slopes for focal predictor isoflavones and SBP as a function of serum calcium at the 10th (Low Ca2+), 50th (Median Ca2+), and 90th (High Ca2+) percentiles of values found in our study samples. Panels C to F show the regions of significance and 95% confidence bands for the regression slope estimates for the conditional relation between SBP and isoflavone concentrations as a function of serum calcium. The dashed vertical lines (----- in panels C-F) indicate calcium thresholds separating regions of statistical significances. Panels A & C for daidzein (DE) as predictor; B & D for genistein (GE); E for sum excretion (DE + GE); and F for difference in excretion (DE – GE). Note that the lengths of all graph lines correspond to ranges of data found in our study samples. Simple slopes for DE + GE and DE – GE are not shown.
