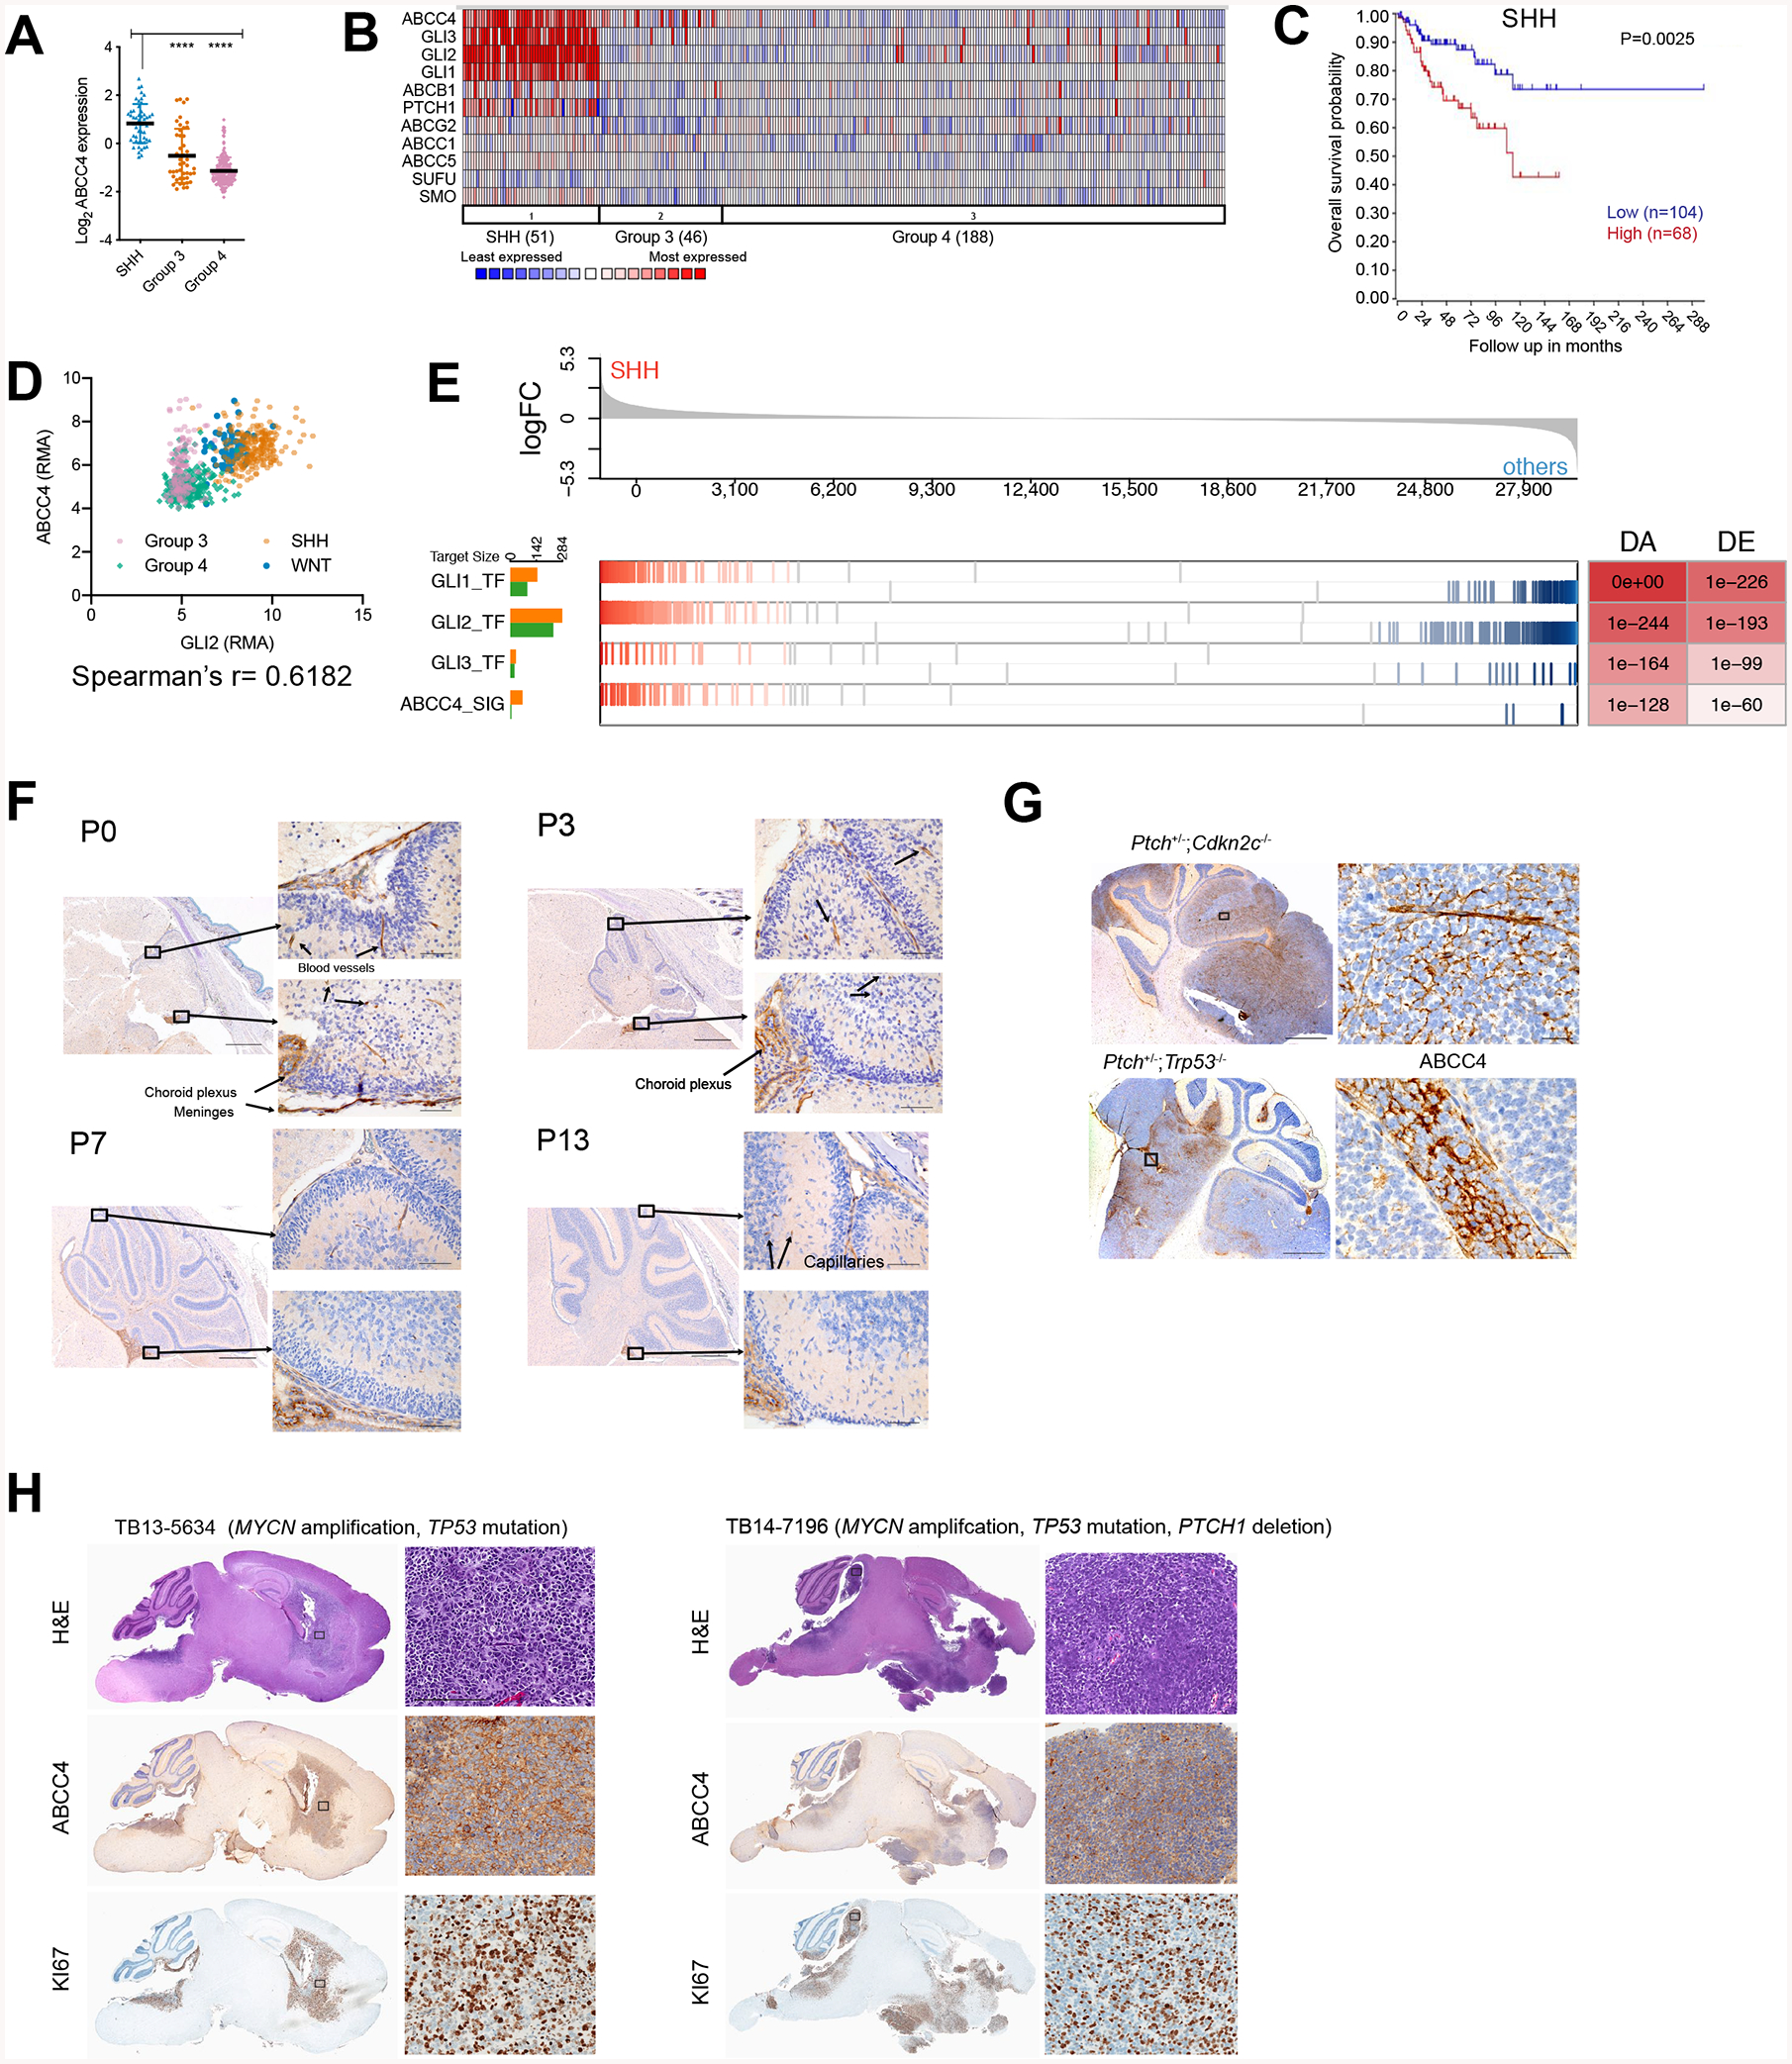
Figure 1. ABCC4 is highly expressed in SHH-MB.

(A) Abcc4 expression in MB cohort from GSE37385, n= 1087 (Northcott et al., 2012b). * P < 0.05, ** P < 0.01, **** P < 0.0001, one-way ANOVA.
(B) Data from (A) where ABCC4 expression and SHH signaling genes are compared in a heatmap.
(C) SHH-MB patients with available survival and gene expression information from GSE85217, n = 763 (Cavalli et al., 2017). The relationship between ABCC4 expression and survival time was analyzed using the Kaplan-Meier method with log-rank statistics.
(D) Analysis of correlation between GLI2 and ABCC4 expression levels from GSE85217 data, n =763. Spearman’s correlation r was 0.6182, P<0.0001.
(E) Enrichment of predicted GLI1, GLI2, GLI3 transcriptional regulons and ABCC4 signaling regulon in differentially expressed genes between SHH and other MB subgroups from GSE85217, n - 763 (Cavalli et al., 2017). P values of regulon enrichment and differential expression of the hub gene are indicated in the DA DE table.
F) Wild type mouse brains were fixed at indicated post-natal days (P0, P3, P7, and P10) and immunostained with antibodies to mouse ABCC4 (anti-ABCC4). Scale bars = 5 mm and 50 μm
(G) Sagittal sections of SHH-MB mouse models (Ptch+/−;Cdkn2c−/−, and Ptch+/−;Trp53−/−) immunostained with anti-ABCC4. Scale bar = 5 mm and 25 μm.
(H) Sagittal sections of SHH-MB patient-derived xenografts. Sections were stained with H&E and with anti-KI67 and anti-ABCC4. Scale bar = 5 mm and 200 μm.
