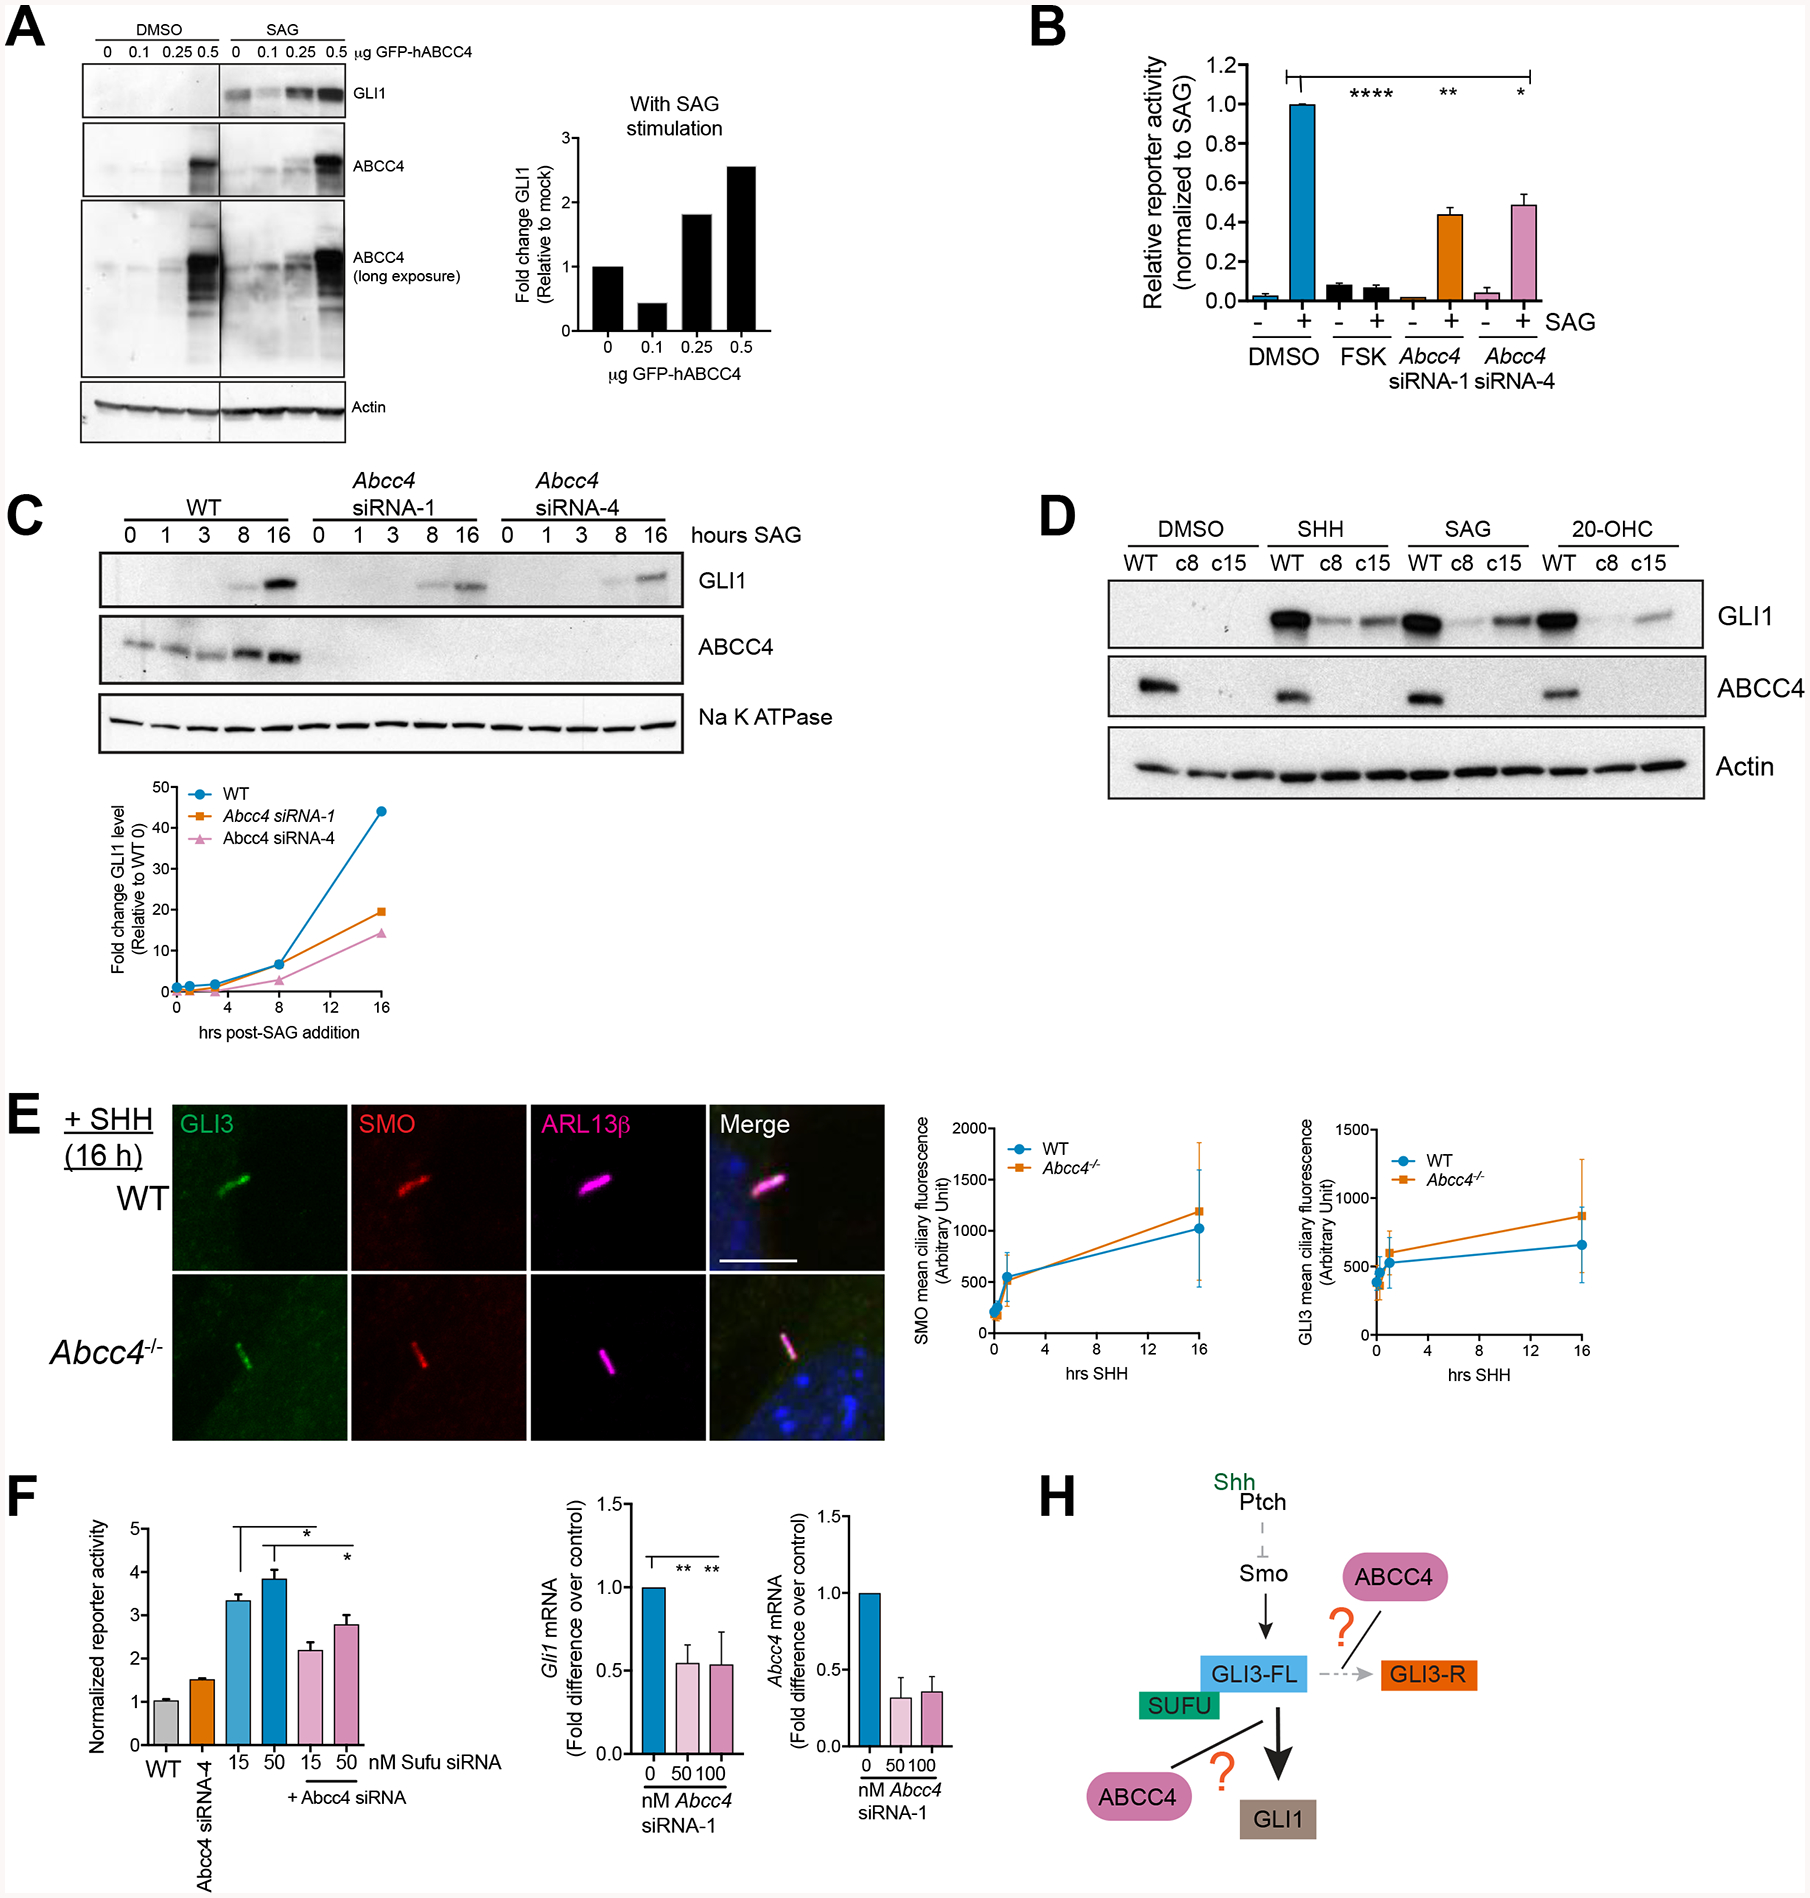
Figure 2. Abcc4 is a positive regulator of SHH signaling.

(A) NIH3T3 cells were transfected with plasmid encoding human ABCC4 and treated with SAG (200 nM) for 16 hours. GLI1 protein level was quantified by densitometry and normalized to the actin loading control (bar graph). Blot is of the same exposure time where irrelevant lanes were removed and marked with black line.
(B) Light2 cells expressing Gli1 reporter construct were transfected with Abcc4 siRNA (15 nM), forskolin/FSK (50 μM), or DMSO control for 24 hours prior to addition of SAG (200 nM). Bars are mean (± SEM) of three independent experiments. * P < 0.05, ** P < 0.01, **** P < 0.0001. One-way ANOVA.
(C) NIH3T3 cells were transfected with Abcc4 siRNAs (15 nM). Cells were harvested at indicated time points post-SAG addition (200 nM). Represenative blot of at least three independent experiments. Levels of indicated proteins were measured by immunoblotting. Na K ATPase was used as a loading control. Lines represent band intensities of blots shown. GLI1 was normalized to DMSO-treated control of WT cells.
(D) WT or clonal Abcc4−/− NIH3T3 were treated with SHH, SAG (200 nM), or 20-OHC (10 uM) for 16 hours. Levels of indicated proteins were measured by immunoblotting. All blots are representative of at least three independent experiments.
(E) WT or Abcc4−/− NIH3T3 cells were treated SAG (200 nM) for 16 hours. Cells were fixed, permeabilized, and stained with SMO, GLI3, and ciliary GTPase, Arl13b. Representative images and quantification are shown. Bars are mean (± SD) of n=40–50 cells/group. Scale bar = 5 μm.
(F) Light2 Gli reporter cells were transfected with indicated Abcc4 and Sufu siRNAs for 24 hours prior reporter activity measurement. Bars are mean (± SD) of a representative experiment. * P < 0.05. One-way ANOVA.
(G) SufuKD cells were transfected with control or Abcc4 siRNA. RNA was isolated 16 hours post-serum starvation. Levels of indicated transcripts were measured by qRT-PCR. Means (± SEM) of two independent experiments are shown. ** P < 0.01. One-way ANOVA.
(H) Schematic of ABCC4 locus in the SHH pathway. ABCC4 functions downstream of SMO where it may affect GLI3-FL to GLI-R conversion or it may act downstream of SUFU.
