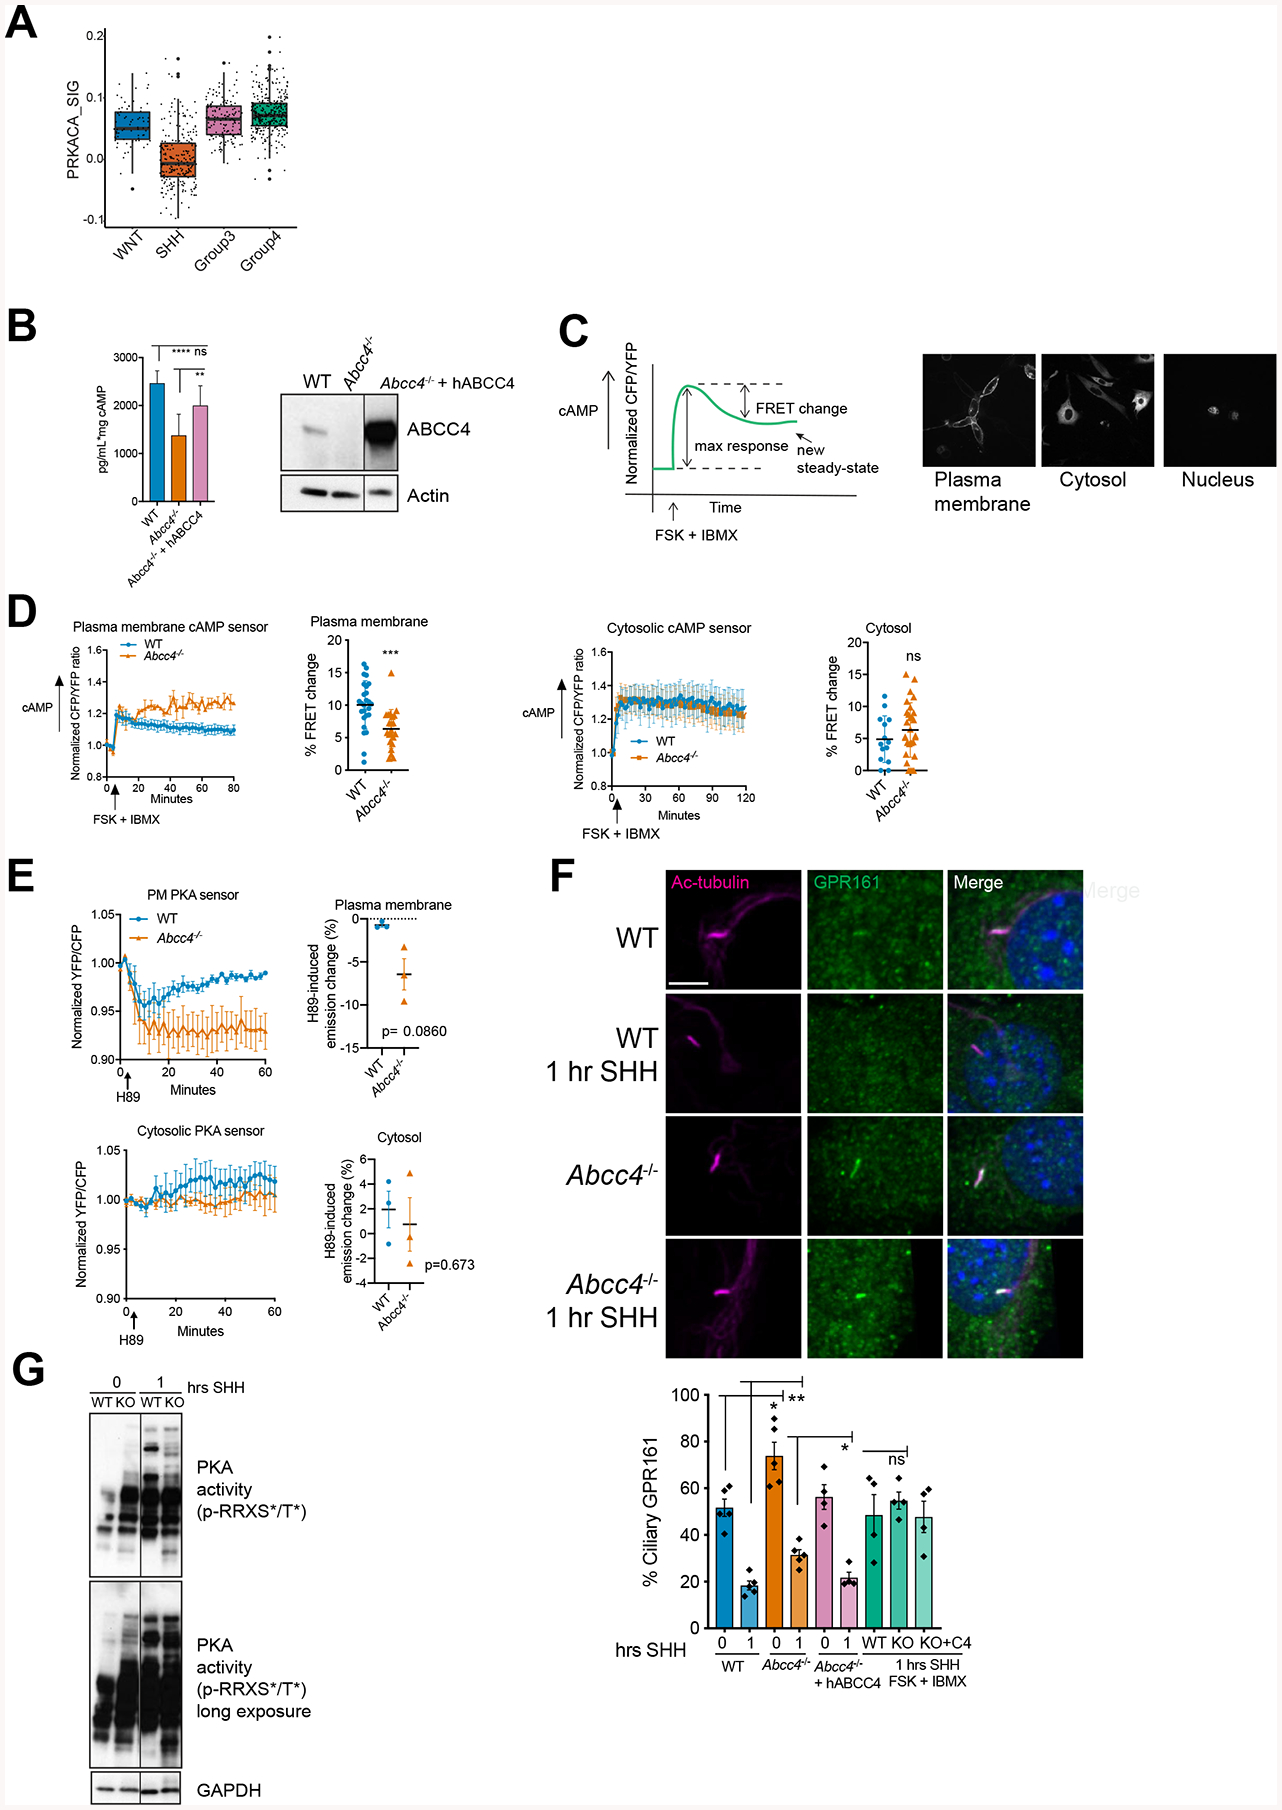
Figure 4. ABCC4 modulates cAMP level and PKA activity to regulate SHH signaling.

(A) Enrichment of predicted PRKACA signaling regulon in differentially expressed genes between SHH and other MB subgroups from GSE85217 (Cavalli et al., 2017). P values of regulon enrichment and differential expression of the hub gene are indicated in DA DE table.
(B) WT, Abcc4−/−, Abcc4−/− cells transiently transfected with GFP-tagged human ABCC4 were treated with forskolin (50 μM) and IBMX (100 μM) for 1 hour. cAMP level in the media was measured by ELISA. Bars represent means (± SD) of two independent experiments. ** P < 0.01, **** P <0.0001, ns = not significant, one-way ANOVA. Level of ABCC4 was measured by immunoblotting. Irrelevant lanes were removed and marked with black line.
(C) Schematic of live-cell imaging FRET experiment. Arrow indicates addition of forskolin (50 μM) and IBMX (100 μM). Representative images of plasma membrane, cytosolic, and nuclear-targeted cAMP sensors.
(D) Representative live-cell imaging analyses of WT or Abcc4−/− NIH3T3 expressing plasma membrane or cytosolic cAMP FRET sensors. Percentage of FRET change is represented as means (± SD) of three independent experiments. * P < 0.05, ** P < 0.01, *** P <0.001, Mann-Whitney test.
(E) Live-cell imaging analyses of WT or Abcc4−/− NIH3T3 expressing plasma membrane or cytosolic PKA FRET sensors. Emission ratio time course (means ± SD) of three independent experiments are shown. H89-induced emission change was calculated by subtracting the emission ratio at the start with the end point emission ratio at 60 minutes and represented as a percent emission change. Mann-Whitney test.
(F) Indicated cells were treated SHH-conditioned media. At indicated time points, cells were fixed, permeabilized, and stained with GPR161 and acetylated-a-tubulin to label cilia. Bars are mean (± SEM) of four or five independent experiments with n=40–50 cells/experiment/group. * P < 0.05, ** P < 0.01, ns = not significant, student’s t-test.
(G) WT or Abcc4−/− NIH3T3 cells were treated SHH for 30 minutes or 1 hour. PKA activity was measured by probing for phosphorylation of PKA substrates at consensus PKA motif, RRXS*/T*. Irrelevant lanes were removed and marked with black line.
