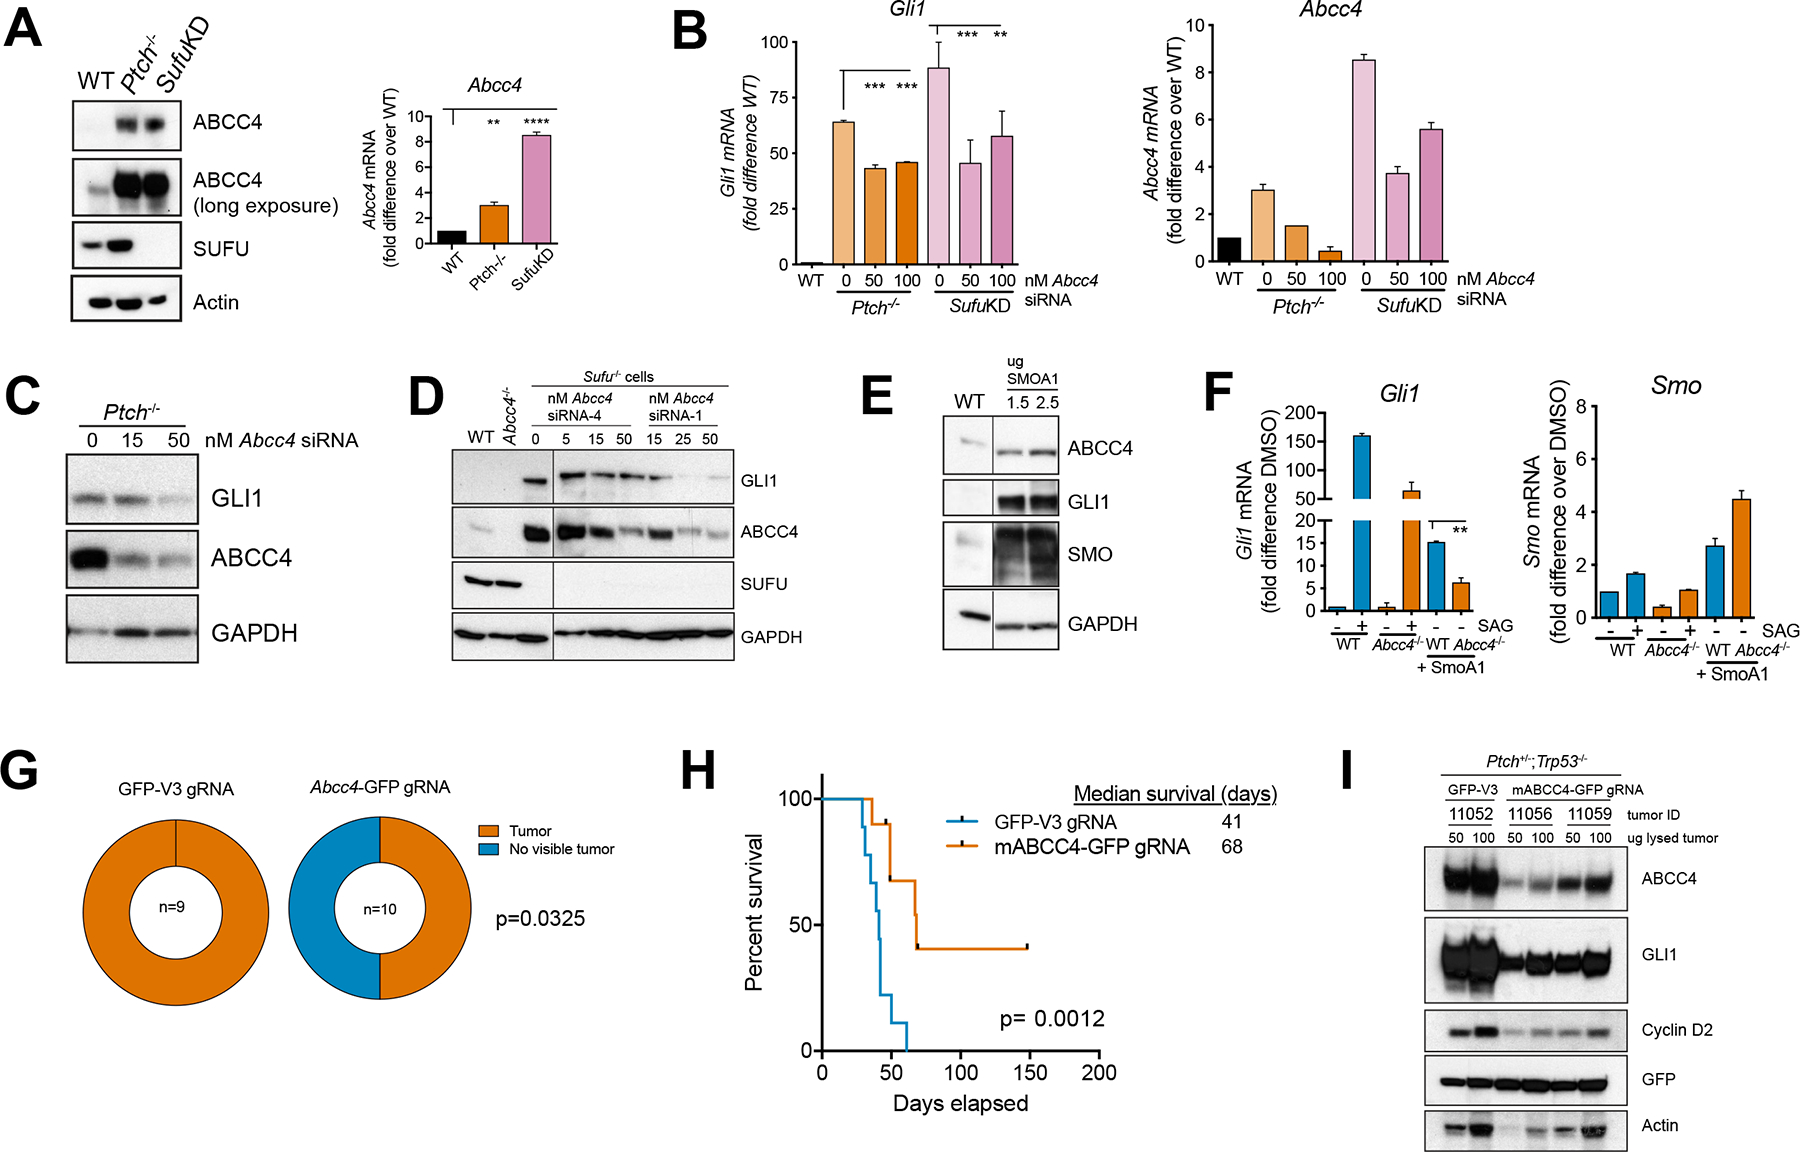
Figure 5. Targeting Abcc4 is a viable strategy to impair aberrant SHH signaling in vitro and in SHH-MB.

(A) NIH3T3, Ptch−/− and Sufu knockdown (SufuKD) cells were harvested 16 hours post-serum starvation. Levels of indicated proteins were determined by immunoblotting. RNA was isolated from Ptch−/−, SufuKD, and WT NIH3T3 cells. Levels of indicated transcripts were measured by qRT-PCR. Bars represent mean (± SD) cumulative from two independent experiments. * P < 0.05, ** P < 0.01, *** P <0.001. One-way ANOVA.
(B) Ptch−/− and SufuKD cells were transfected with Abcc4 siRNA. RNA was isolated and levels of indicated transcripts were measured by qRT-PCR. Bars represent mean (± SD). ** P < 0.01 *** P < 0.001, one-way ANOVA.
(C,D) as in (B) except proteins were harvested. Levels of indicated proteins were determined by immunoblotting. Irrelevant lanes were removed and marked with black line. Representive blot from two independent experiments.
(E) NIH3T3 cells were transfected with exogenous SmoA1. Levels of indicated proteins were determined by immunoblotting. Irrelevant lanes were removed and marked with a black line. Bars represent abundance of indicated proteins relative to untreated control. Representive blot from two independent experiments.
(F) WT or Abcc4−/− NIH3T3 transfected with SMOA1. RNA was isolated and levels of indicated transcripts were measured by qRT-PCR. Representive of two independent experiments. Bar represents mean (± SD) . ** P < 0.01 *** P < 0.001, one-way ANOVA.
(G) Tumor incidence from between control gRNA mice recipients compared to Abcc4 gRNA mice recipients. *p < 0.05, Fisher’s exact test.
(H) Kaplan-Meier with log-rank statistics survival curve of CD-1 nude mice bearing Ptch−/−;Trp53−/− SHH-MB tumor infected with either control gRNA or gRNA targeting exon 4 of mouse Abcc4 (n=9–10/group. Two independent experiments).
(I) Representative tumor chunks obtained from (D) were lysed and levels of indicated proteins were measured by immunoblotting.
