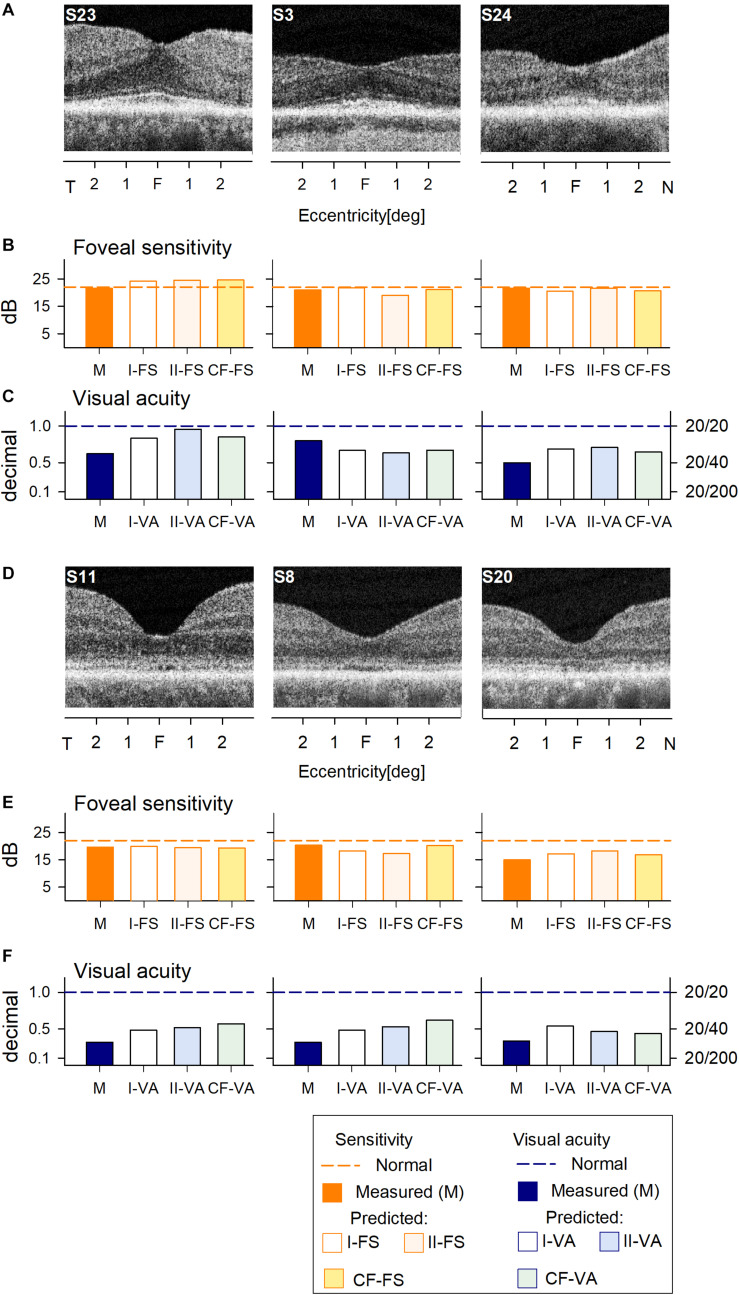
FIGURE 1.
Prediction of foveal sensitivity (FS) and visual acuity (VA) in the IRD training set group. (A) Foveal region OCT scans from 3 IRD subjects (S23, S3, S24) representing different ONL thicknesses. (B) Comparison of measured FS (M, orange bar) and predicted results by Model I-FS (white bar) and Model II-FS (light orange bar). Yellow bar is FS value calculated by formula extracted from curve fitting (CF-FS). (C) Comparison of measured VA (dark blue bar) and predicted by Model I-VA (white bar) and Model II-VA (light blue bar). Light green bar is VA calculated by a formula extracted from curve fitting (CF-VA). (D–F) are the same as (A–C) but the scans are from 3 IRD subjects (S11, S8, S20) who have visible defects of IS/OS similar to those encountered in some BCM patients. Dashed lines in (B,C,E,F) represent lower boundary of normal range.

