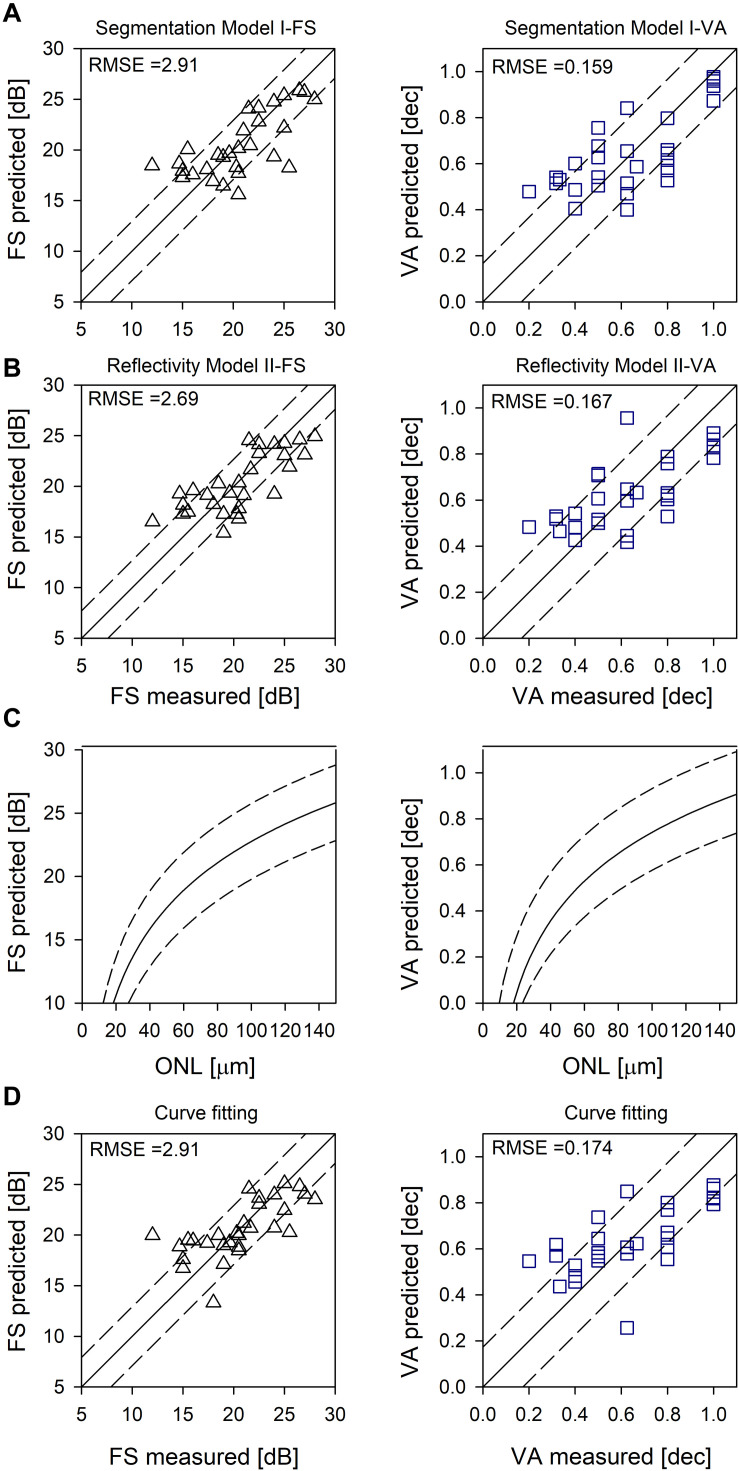
FIGURE 2.
Evaluation of the models. (A) Random forest segmentation Model I-FS and I-VA showing predicted versus measured values. (B) Random forest Model II-FS and II-VA showing predicted versus measured values. Equality line (y = x) is superimposed (solid line); RMSE are shown as dashed lines (A,B). (C) Logarithmic curve [y = y0 + a*log(x)] fitted to FS versus ONL, and VA versus ONL (solid lines). (D) Prediction based on curve fitting. Equality line (y = x) is superimposed (solid line). RMSE are shown as dashed lines (C,D).

