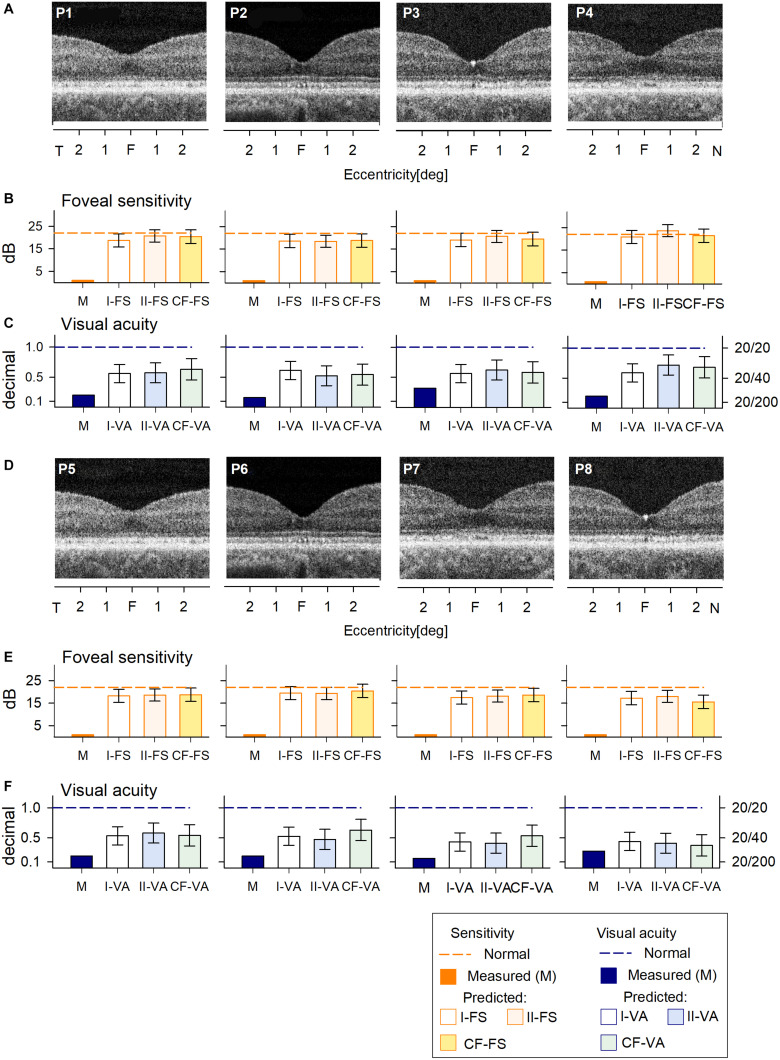
FIGURE 3.
Prediction of FS and VA of BCM patients with large deletion mutations. (A) Foveal region OCT scans from four BCM patients (ages 7–13 years). (B) Non-detectable sensitivity at foveal location (orange bar) and predicted results by Model I-FS (white bar) and Model II-FS (light orange bar) as in Figure 1. Yellow bar is sensitivity value calculated by formula extracted from curve fitting (CF-FS). (C) Comparison of measured VA (dark blue bar) and predicted results by Model I-VA (white bar) and Model II-VA (light blue bar). Light green bar is visual acuity calculated by formula extracted from curve fitting (CF-VA). (D–F) are the same as (A–C) but BCM patients are older (ages 18–35 years); dashed lines in (B,C,E,F) represent lower boundary of normal range. Error bars represent RSME for corresponding model.

