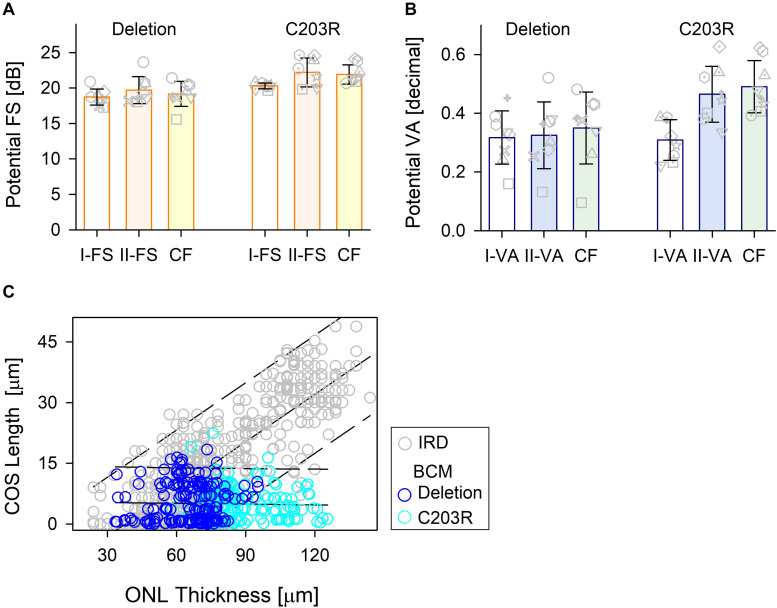
FIGURE 5.
Comparison of the treatment potential (difference between prediction and measured values) for the three methods in the two BCM genotypes. (A) Treatment potential for FS in deletion mutations and C203R mutation patients. Model 1, white bar; Model II, light orange bar; CF, light yellow bar. (B) Treatment potential for VA in the two groups. Model 1, white bar; Model II, light blue bar; CF, light green bar. Individual subjects, gray unfilled symbols; error bars, standard deviation. (C) Relation between ONL thickness and COS length for IRD patients used in the training set (gray circles) and those for BCM patients (deletion, dark blue circle; C203R, cyan circle).

