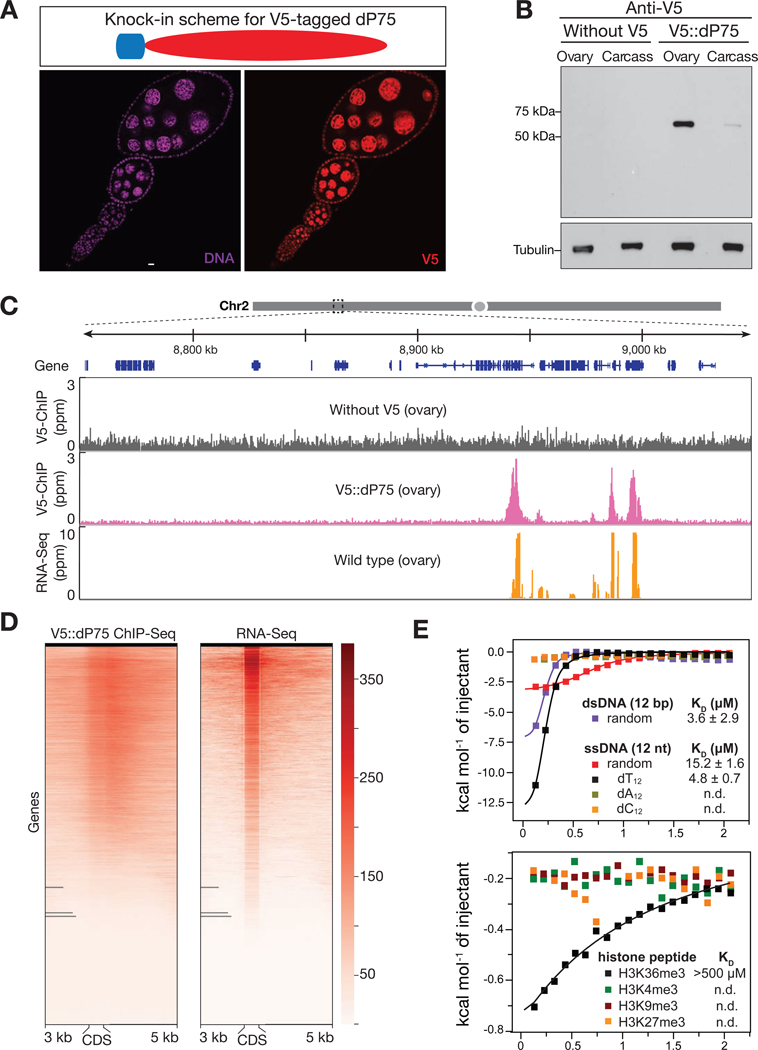
Fig. 2.
dP75 binds to actively transcribed chromatin regions in vivo. A: dP75 expression pattern as examined by V5 antibody staining in ovaries with V5 knocked-in at endogenous locus of dP75. B: Validation of V5 tag knock-in at endogenous dP75 locus by western blot. Western Blot were carried out using anti-V5 antibody. After V5 detection, the same membrane was used for western blot of internal control (using anti-Tubulin antibody). Carcass: fly body with ovaries ectomised. C: V5 ChIP-Seq and RNA-Seq signal across a 300 kb representative genome region on chromosome 2. V5 ChIP-seq performed in ovaries without V5 tag serves as negative control. D: Heatmap for V5-dP75 ChIP-seq signal on genes and their mRNA levels in wild-type fly ovaries. Each line from the heatmap represents the coding region of one gene plus 3kb upstream and 5kb downstream of the coding region. E: Isothermal titration calorimetry (ITC) measurement of the binding affinity of PWWP domain to different oligos (upper panel), and various histone peptides (lower panel). ITC measurements were performed in duplicates. Binding isotherms and standard deviation were derived from nonlinear fitting using Origin 8.0 (MicroCal, Inc). The initial data point was routinely deleted. The ITC data were fit to a one-site binding model in 1:1 binding mode.

