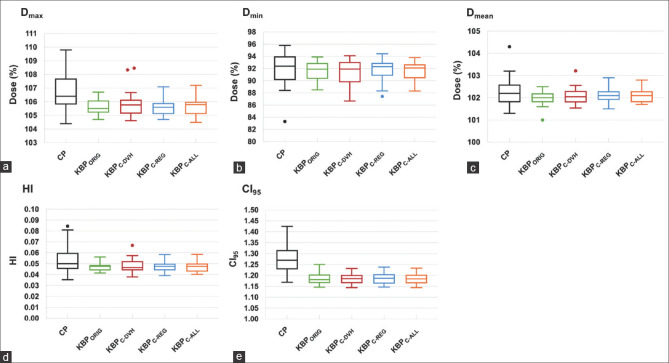
Figure 2.
(a) Dmax, (b) Dmin, (c) Dmean, (d) HI, and (e) CI95. Comparison of dose parameters for the PTV − R among the KBPs and the clinical plans. Middle, lower, and upper lines in each box are the median value, first quartile, and third quartile, respectively. Whisker values do not contain the outliers, which are plotted as individual points. PTV − R: Planning target volume minus the rectum, KBP: Knowledge-based treatment planning

