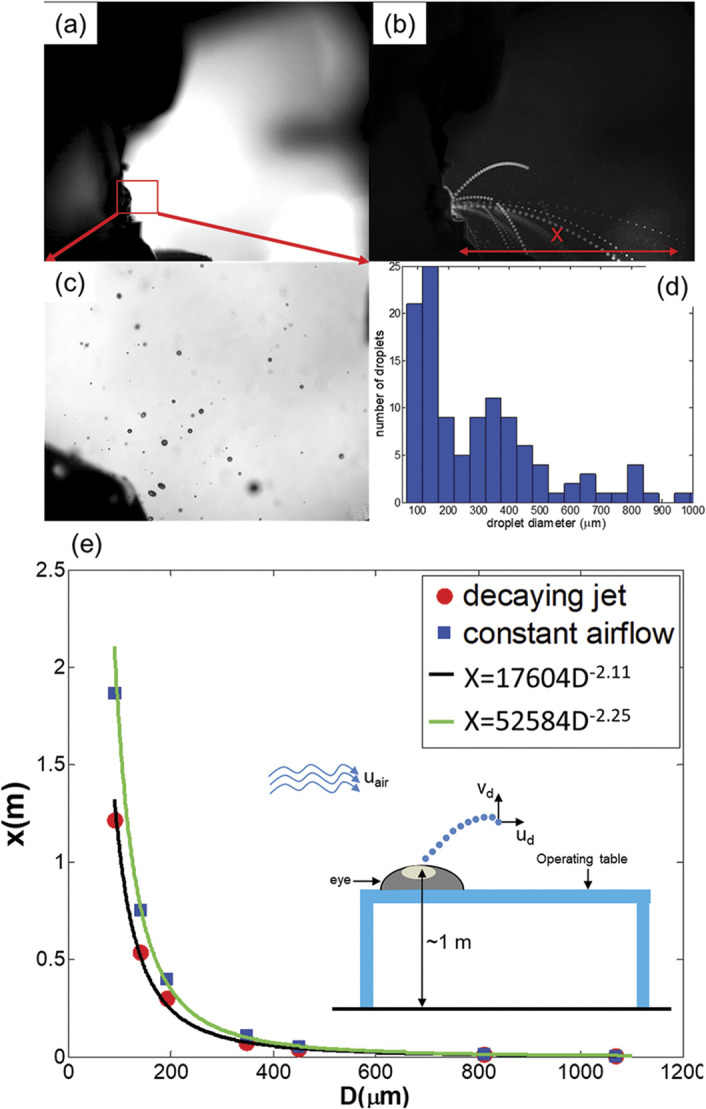
Figure 4.

A: Side-view shadowgraph of the experimental setup before commencing the microkeratome; (B) superimposed images of the imaged area during the procedure illustrate the droplet trajectory. Here, x was the horizontal distance traveled by the droplet; (C) magnified image showing droplets of different sizes; (D) droplet size distribution presented as a histogram; (E) computed value of x from the drag equation plotted against the droplet diameter, D (in micrometers).
