
Extended data Fig. 9 |.
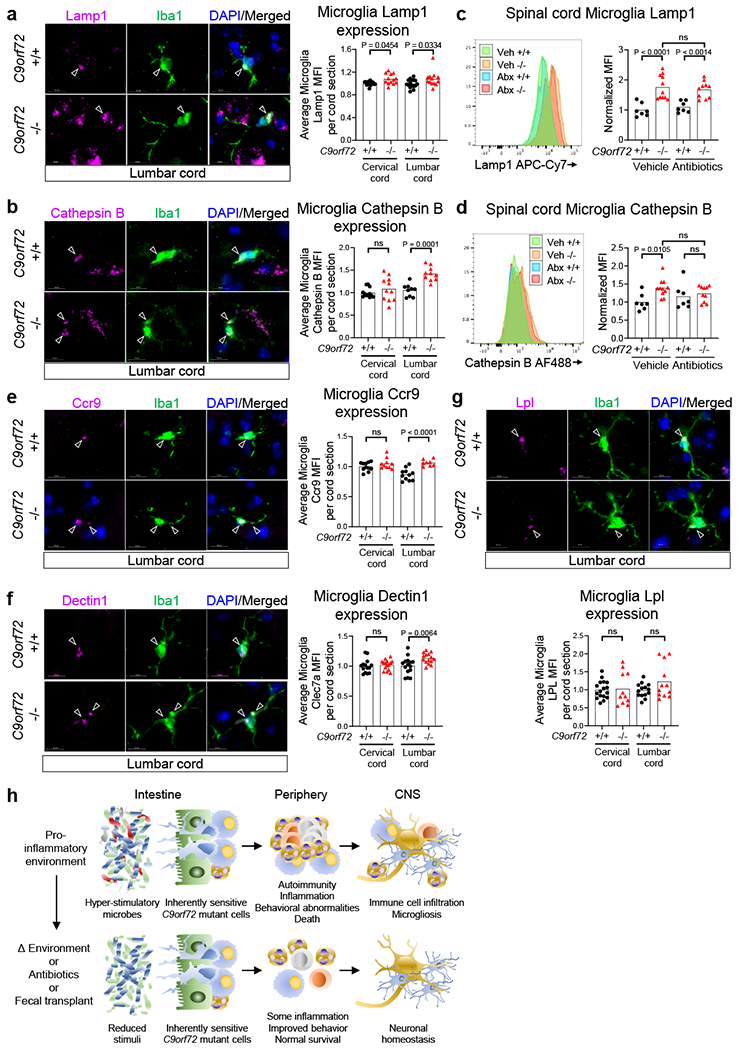
Elevated lysosomal proteins and microgliosis in C9orf72 LOF spinal cord.
a-b,e-g, Orthogonal projection and quantification of confocal imaging of a, Lamp1, b, Cathepsin B, e, Ccr9, f, Dectin1/Clec7a, and g, Lpl in Iba1+ microglia in 55-week-old C9orf72Harvardspinal cord (One way ANOVA with Sidak multiple comparisons). Each dot represents the average mean fluorescent intensity (MFI) of the antigen within microglia on a given spinal cord section. >100 microglia surveyed per section. Sections from n=3 C9orf72 +/+ and n=3 C9orf72 −/− mice surveyed, c-d, Flow cytometry quantification of c, Lamp1 or d, Cathepsin B in CD45mid CD11b+ CD39+ microglia from spinal cord of C9orf72Harvard neo deleted mice in Fig. 2. One way ANOVA with Sidak multiple comparisons, h, Graphical illustration of C9orf72 functioning within the hematopoietic system to restrict the development of inflammation, autoimmunity, peripheral immune infiltration into the central nervous system (CNS) and microgliosis in response to hyper-stimulatory communities of gut microflora. The microglia image was modified from Servier Medical Art (https://smart.servier.com/smartimage/microglia-2/) under license “CC BY 3.0”.