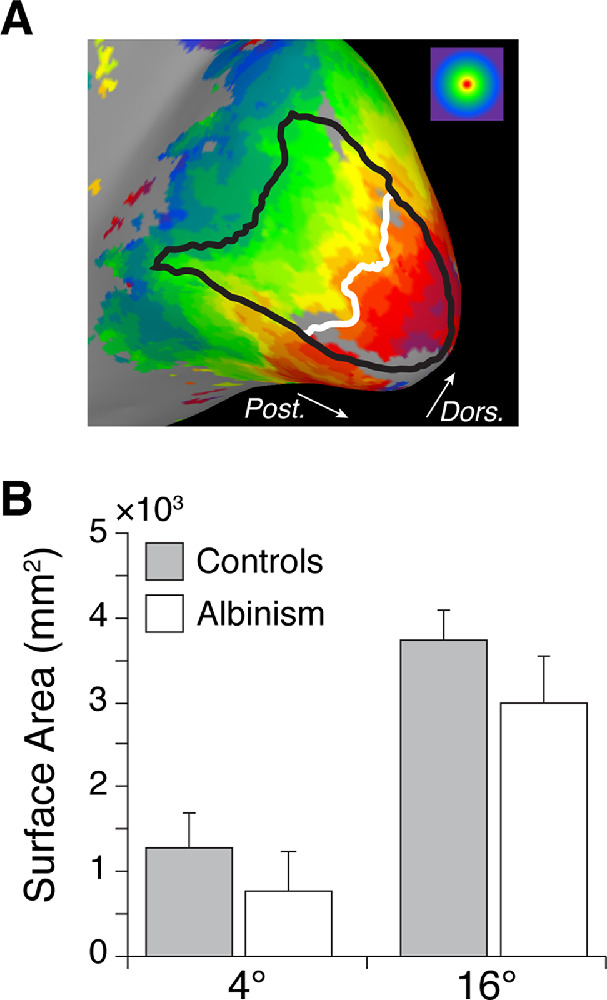
Figure 3.

Total V1 surface area (SA) in both hemispheres within 4° and 16° eccentricity. (A) Manually drawn V1 boundary within 16° eccentricity (black) and 4° isoeccentricity contour (white) shown on the inflated medial occipital lobe surface of a representative control participant. Color coding for eccentricity is shown in the upper-right corner. White arrows indicate posterior (Post.) and dorsal (Dors.) orientation. (B) Mean V1 SA within 4° and 16° eccentricity in controls and participants with albinism. Error bars represent 1 SD. Values within 16° for participants with albinism are from only four participants owing to incompleteness of cortical maps in one participant (JC_10230). V1 SA is not significantly different between participants with albinism and controls either within 4° eccentricity, unpaired t-test: t = 2.14, df = 8, p = 0.065, or within 16° eccentricity, Mann-Whitney U test: U = 2, p = 0.064.
