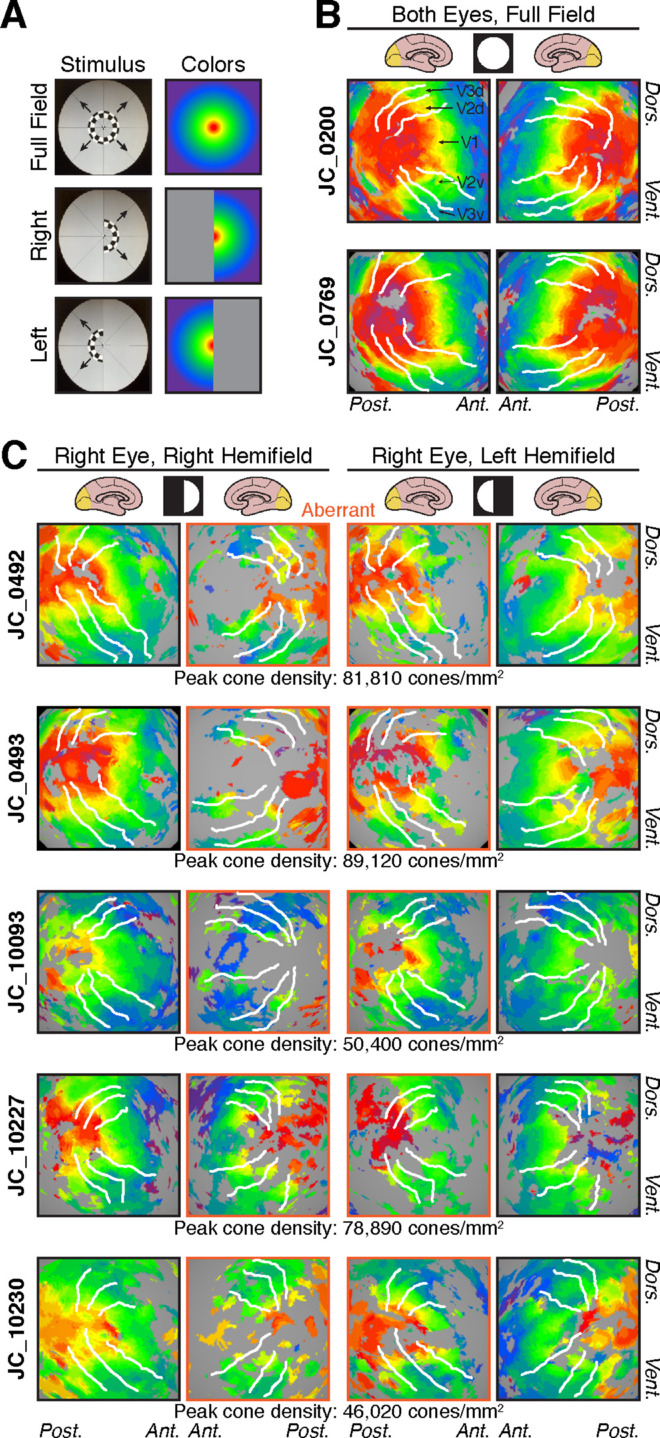
Figure 4.

Retinotopic maps of visual field eccentricity. (A) Visual stimuli and color coding used for eccentricity mapping in controls (full field) and participants with albinism (hemifield stimuli). (B) Eccentricity maps for two representative control participants. All control participants were tested using binocular viewing of the full-field ring stimulus. (C) Eccentricity maps for participants with albinism, obtained using hemifield ring stimuli, viewed monocularly. Data for the right eye viewing condition are shown here (see Supplementary Figure S1 for left eye data). Retinotopy patterns outlined in orange (middle columns) are aberrant ipsilateral hemifield representations. Peak cone densities for each participant with albinism are indicated below each row. All retinotopic maps are displayed on spherically inflated cortical surface models. Visual stimuli are indicated by white circle/semicircle symbols at head of respective columns. White lines in B and C mark dorsal and ventral boundaries of V1/2/3 based on polar angle data (cf. Figure 1); visual areas are labeled on the left hemisphere of JC_0200 in panel (B), and labels apply for all images. Dors. = dorsal; Vent. = ventral; Ant. = anterior; Post. = posterior.
