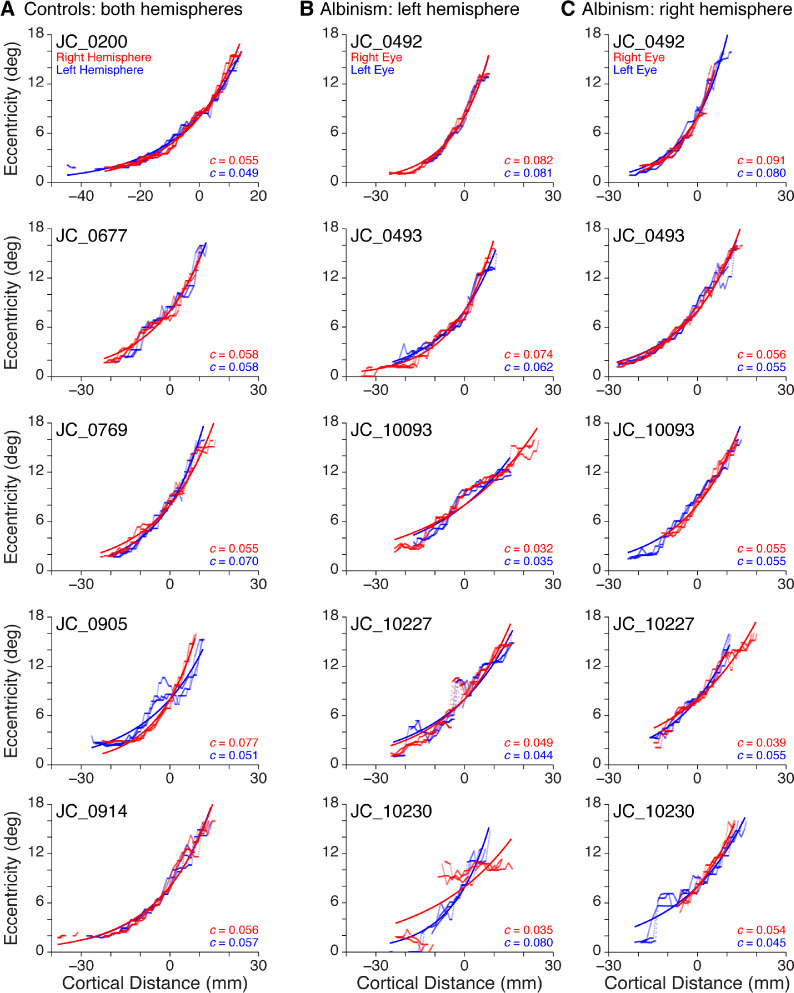
Figure 5.
Empirical cortical mapping data and fitted functions for all participants. (A) Controls: right hemisphere (red) and left hemisphere (blue). (B) Albinism: left hemisphere, right hemifield stimulus. (C) Albinism: right hemisphere, left hemifield stimulus. Viewing conditions in B, C: right eye (red), left eye (blue). The map scaling factor for each fitted curve (Equation 3) is included in the lower-right corner of each graph.

