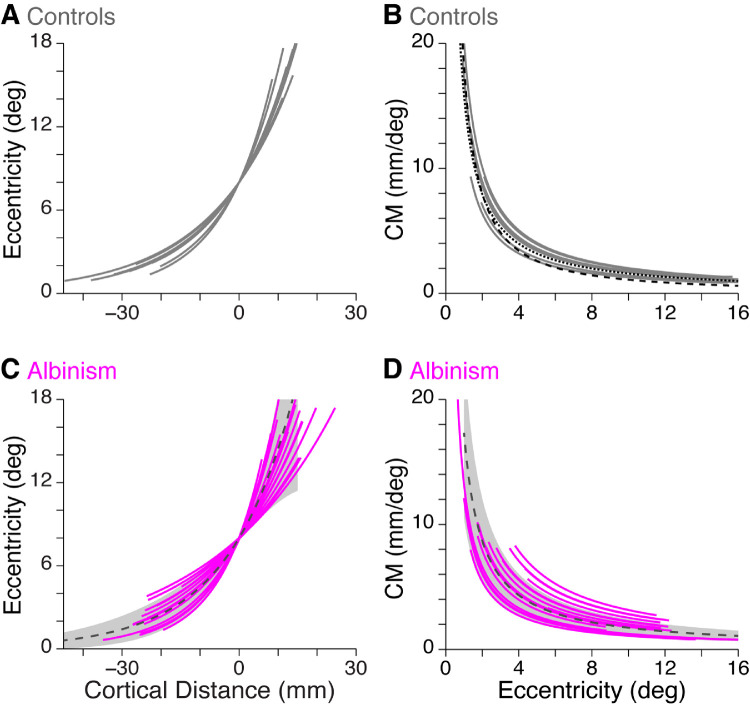
Figure 6.
Cortical mapping and magnification functions in controls and participants with albinism. (A) Fitted cortical mapping functions and (B) corresponding CMFs (see Methods) for both hemispheres of all control participants (gray curves). In (B) the CMFs reported by Sereno et al. (1995) (dashed black curve) and by Engel, Glover, & Wandell (1997) (dotted black curve) are shown for comparison. (C) Fitted cortical mapping functions and (D) corresponding CMFs for participants with albinism (magenta curves). Dashed dark gray lines and gray shaded regions show mean ± 1 SD for controls. In C and D, data are combined for left hemisphere, right hemifield stimulus and right hemisphere, left hemifield stimulus and for both right and left eye viewing conditions.

