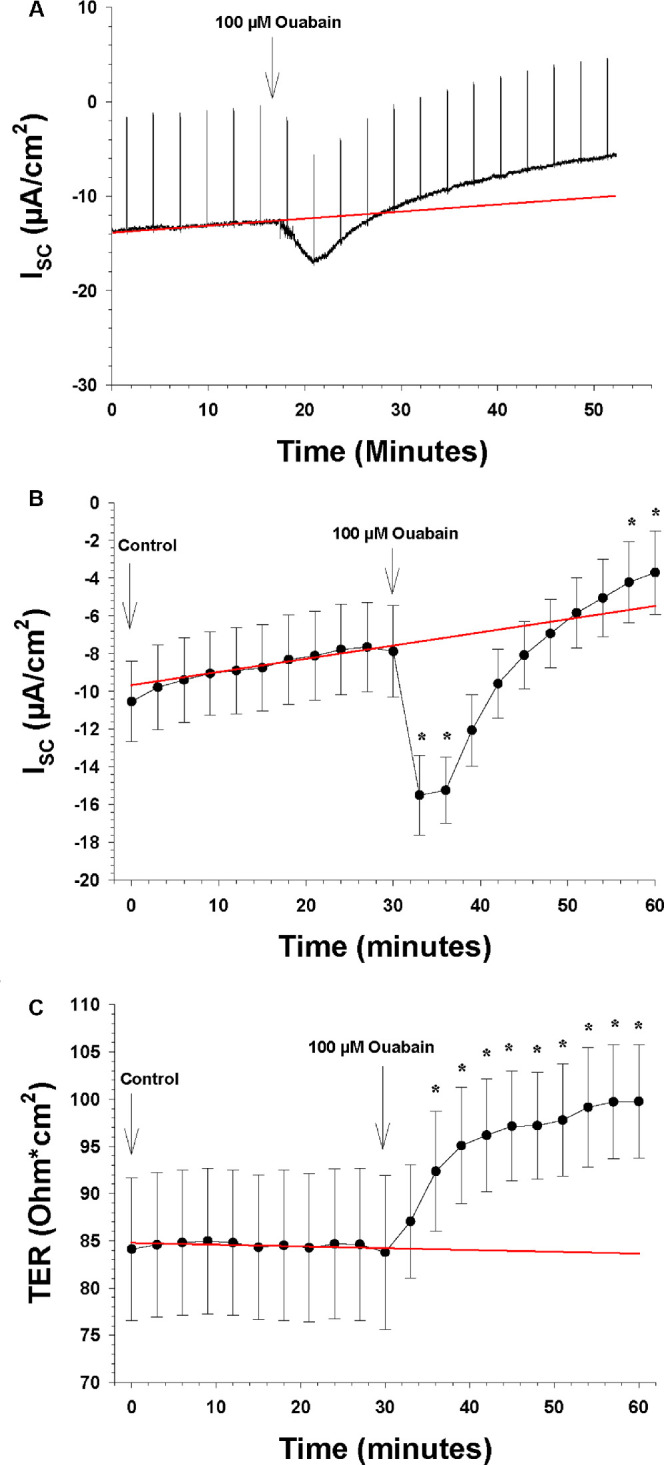
Figure 6.

The effects of the apical and basolateral Na-K-ATPase blocker ouabain on ISC and TER (n = 7). The arrows show the time points when a new bath solution was applied to the bath or when the Na-K-ATPase blocker was added to the bath solution. (A) Continuous recording of the ISC as a function of time before and after the apical and basolateral change of normal Krebs solution to low K+ Krebs solution. The upward deflections are current responses to voltage pulses of 1 mV every 5 minute, 1 ms in duration, to measure TER. The red line is the control regression line calculated between the last three ISC measurements of the control period at the beginning and the last three ISC measurements of the control period at the end of the experiment. (B) The ISC as a function of time before and after the apical and basolateral application of the K-ATPase blocker to the bath solution. The ordinate shows the measured value of the ISC (in µA/cm2), and the red line is the control regression line, as in A. (C) TER as a function of time before and after the apical and basolateral application of the Na-K-ATPase blocker to the bath solution. The ordinate shows the measured value of TER (in ohm·cm2), and the red line is the control regression line, as in A.
