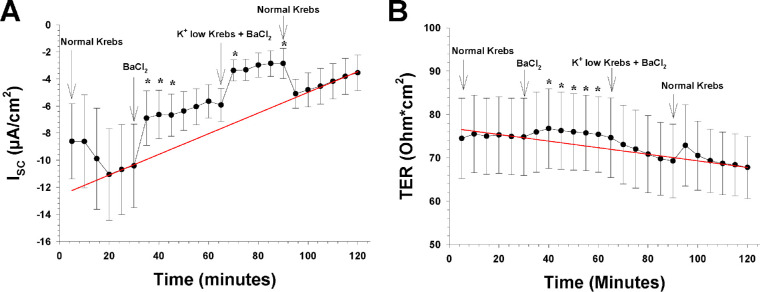
Figure 8.
The effects of blocking barium-sensitive K+ channels on both sides by adding 1-mM BaCl2 to the extracellular fluid (n = 8). The arrows show the time point where a new bath solution was applied to the bath or when the barium-sensitive K+ channel blocker BaCl2 was added to the bath solution. (A) The ISC as a function of time before and after the apical and basolateral application of BaCl2 (1 mM) and 30 minutes later the change to low K+ Krebs solution (0-mM K+ concentration) with BaCl2 (1 mM). The ordinate shows the measured value of the ISC (in µA/cm2), and the red line is the control regression line calculated between the last three ISC measurements of the control period at the beginning and the last three ISC measurements of the control period at the end of the experiment. (B) TER as a function of time before and after the apical and basolateral application of BaCl2 and the change of normal Krebs solution to low K+ Krebs solution with BaCl2 (1 mM). The ordinate shows the measured value of TER (in ohm·cm2), and the red line is the control regression line, as in A.

