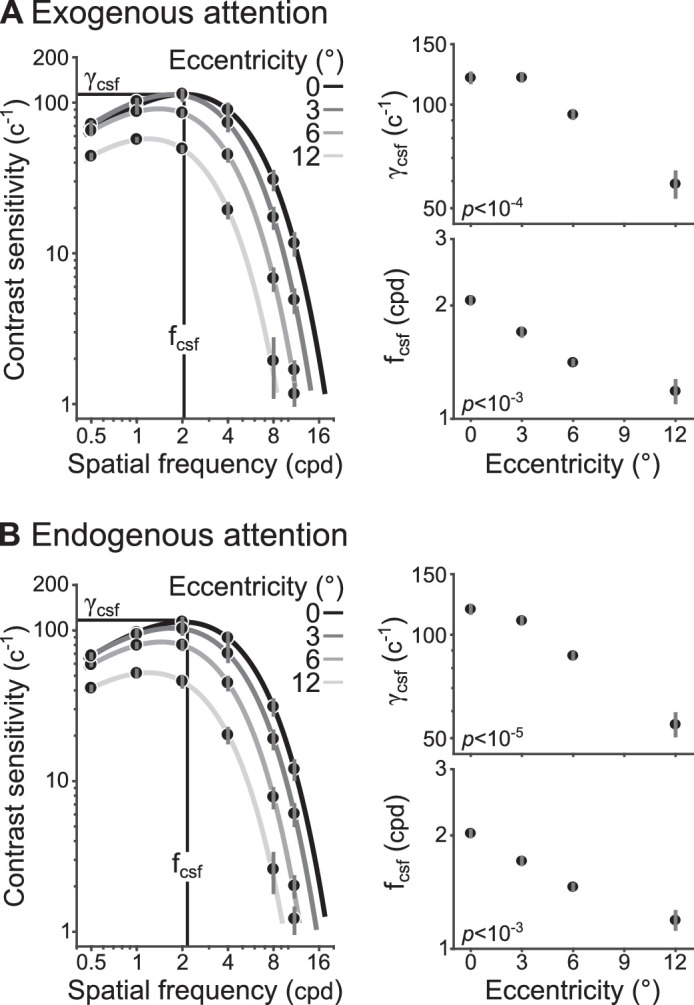
Figure 4.

Neutral contrast sensitivity functions for (A) exogenous and (B) endogenous attention conditions. Parameters fcsf (vertical black line) and γcsf (horizontal black line) are shown for foveal (0°) targets. Estimates for γcsf and fcsf at each eccentricity are shown in the right column. The p values were determined from one-way ANOVAs assessing the effect of eccentricity on each parameter. Dots show group-average and error bars represent ±1 SEM.
