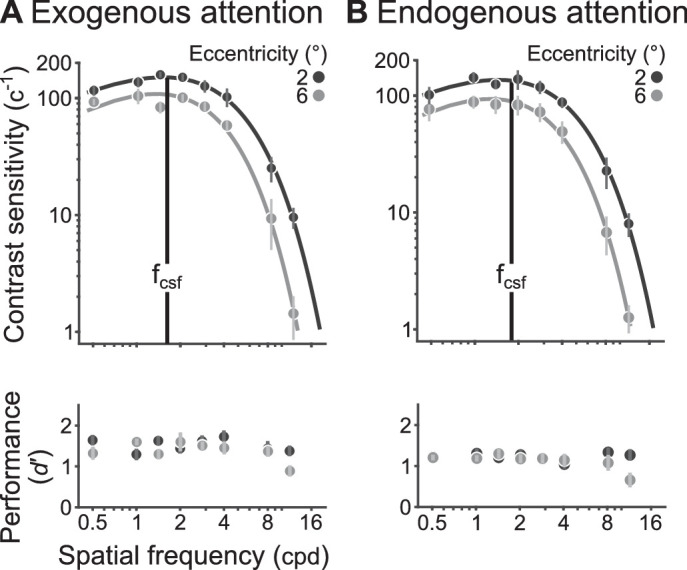
Figure 8.

Neutral contrast sensitivity functions (top) and performance (bottom) for (A) exogenous and (B) endogenous attention conditions. fcsf (vertical black line) is shown for 2° targets. Dots show group-average, and error bars represent ±1 within-subject SEM (Morey, 2008).
