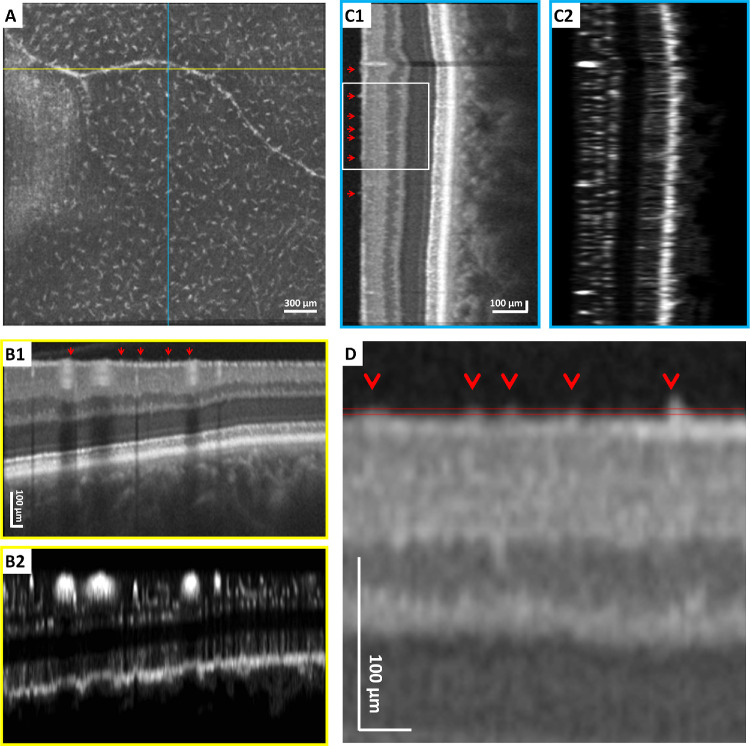
Figure 1.
The 3-mm × 3-mm en face OCT-R imaging of the temporal retina in a healthy control using a clinical OCT device. (A) The 3-µm OCT-R slab located above the ILM, showing regular spatial separation of macrophage-like cells. Fovea is located to the left of the image. (B1, B2) Horizontal OCT and OCT-A B-scan at the position indicated by the yellow horizontal line in A. (C1, C2) Vertical OCT and OCT-A B-scan at the position indicated by the blue vertical line in A. (D) Magnified OCT B-scan (rotated horizontally) at the region indicated by the white box in C1. The axial depth of the 3-µm OCT-R slab in A is indicated by the parallel red lines. Red arrows indicate individual cells on the ILM surface. All B-scans were flattened at the ILM for better visualization of the macrophage-like cells on the ILM surface.

