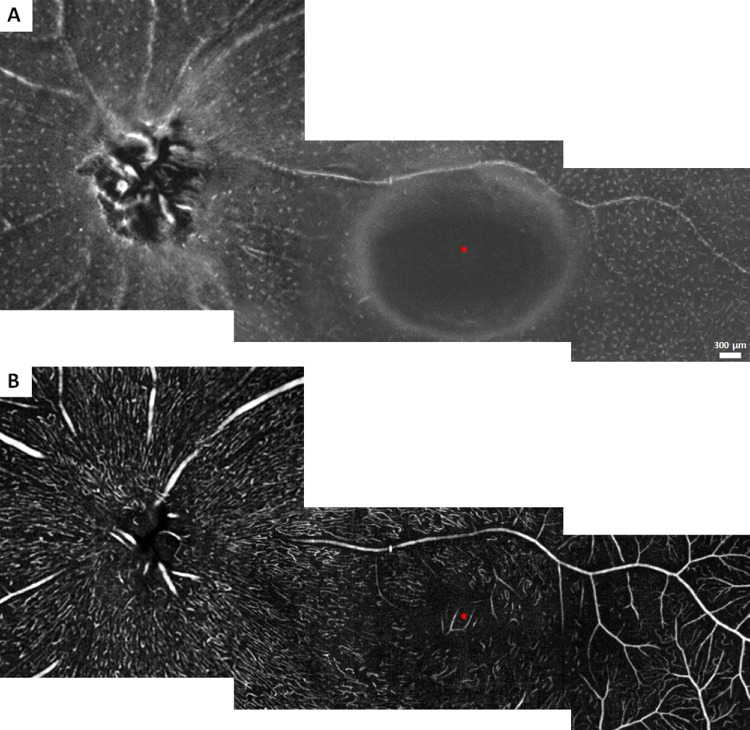
Figure 3.
Spatial distribution of macrophage-like cells and the corresponding superficial retinal vascular network across the retina in a single example of a healthy control. (A) Montage of 3-µm OCT-R slabs located above the ILM surface. (B) Montage of 27-µm OCT-A slabs located below the ILM surface. Asterisks indicate the center of the foveal avascular zone.

