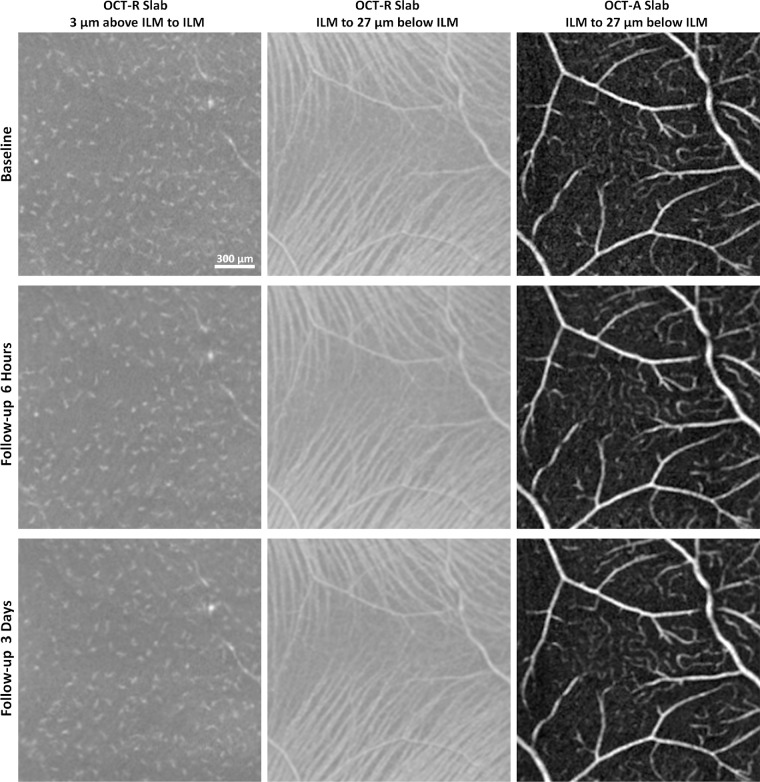
Figure 4.
In vivo imaging of macrophage-like cells over time in a healthy control. Left column: 3-µm OCT-R slabs located above the ILM surface. Middle column: 27-µm OCT-R slabs located below the ILM surface, showing the retinal nerve fiber bundles at the temporal raphe. Right column: 27-µm OCT-A slabs located below the ILM surface. Fovea is to the left of all images.

