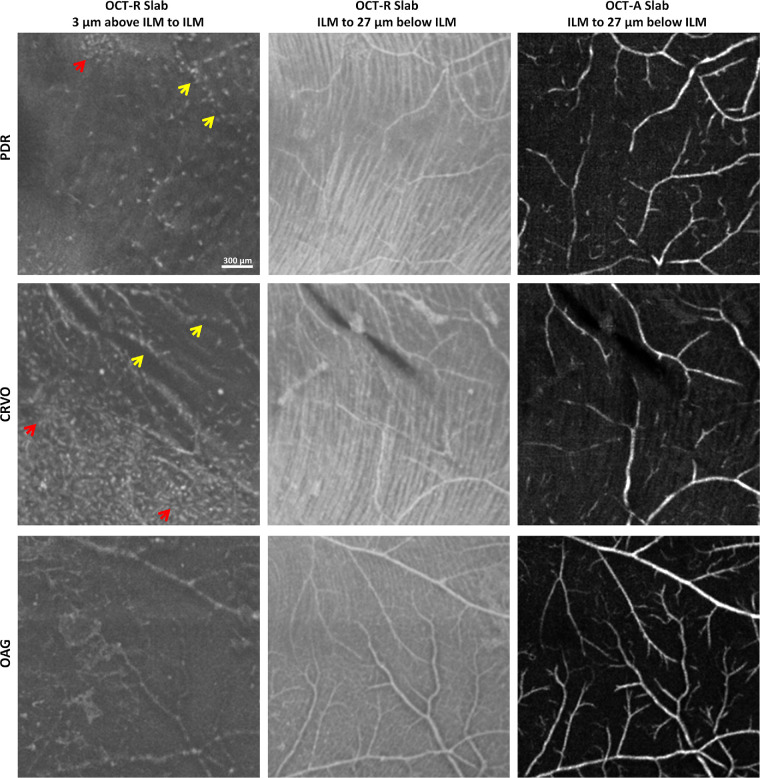
Figure 6.
In vivo imaging of macrophage-like cells in patients with retinal pathologies. Left column shows 3-µm OCT-R slabs located above the ILM in patients with PDR (top row), CRVO (middle row), and OAG (bottom row) showed nonuniform distribution and altered morphology of the macrophage-like cells. Corresponding OCT-R and OCT-A of the underlying retinal nerve fiber bundles along the temporal raphe and superficial retinal vascular network are shown in the middle and right columns. Red arrows indicate clusters of cells. Yellow arrows indicate colocalization of cell structures and larger blood vessels. Fovea is to the left of all images.

