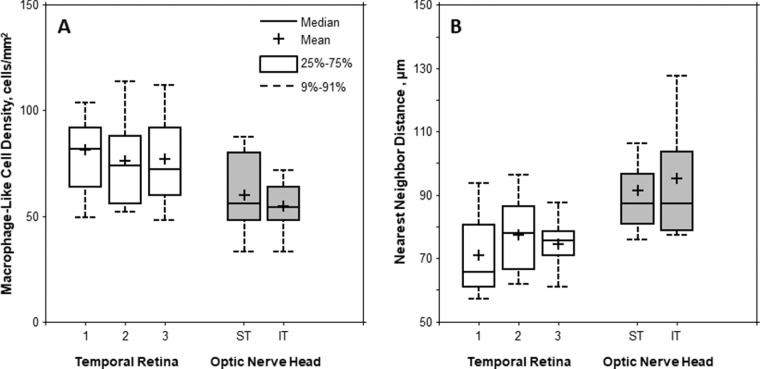
Figure 8.
Boxplots of the (A) macrophage-like cell density and (B) NND measured on the temporal retina at three imaging sessions and ONH (superotemporal [ST] and inferotemporal [IT]). Mean macrophage-like cell density was significantly higher in the temporal retina than that of the ONH (P = 0.001, Wilcoxon signed-rank test). However, the mean NND was significantly lower in the temporal retina than that of the ONH (P < 0.001, Wilcoxon signed-rank test).

