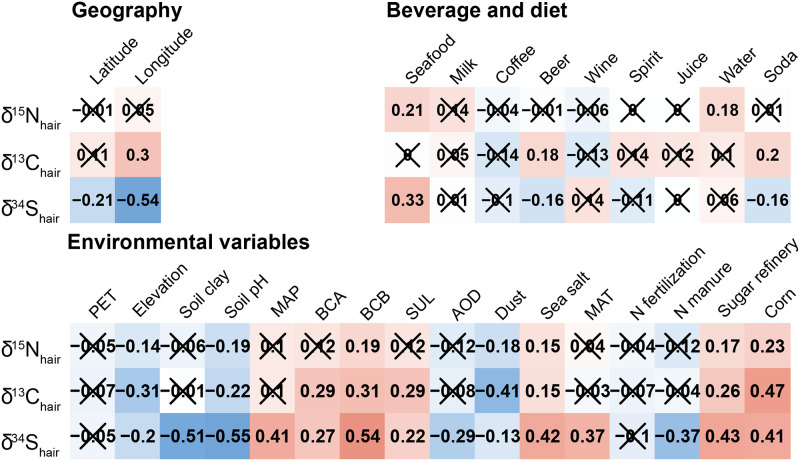
Fig 3. Pearson correlation coefficient between isotopic data in hair and the continuous dietary choice, geographic and environmental variables.
Red and blue squares indicate significant positive or negative correlation (p-value<0.01) whereas crosses indicate no significant correlation (p-value>0.01).

