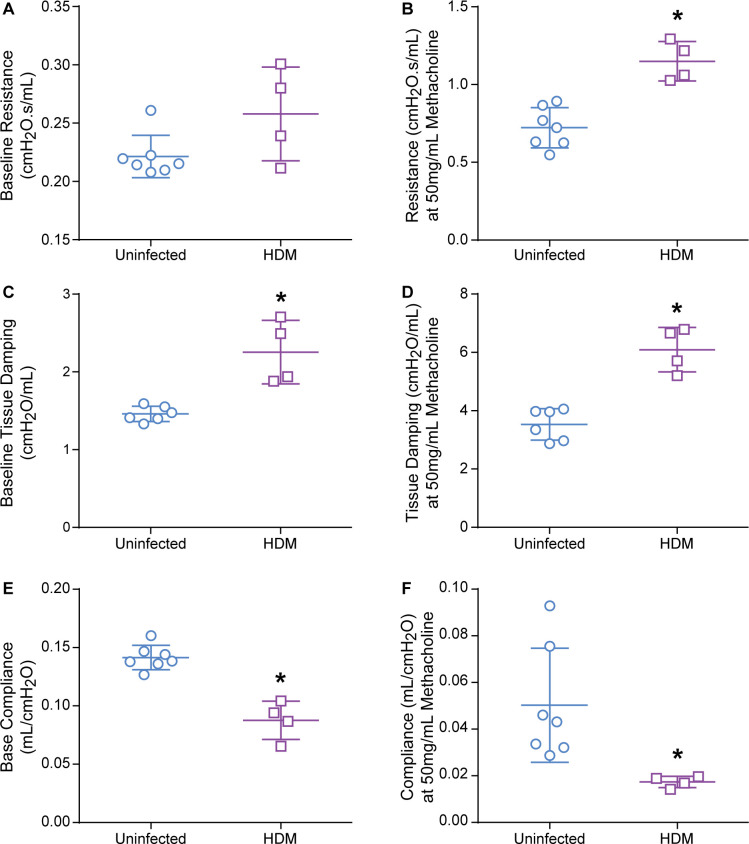
Fig 6. Lung mechanics in uninfected cotton rats and HDM-sensitized female cotton rats.
The mean and standard deviation for each group are represented. Fig a-b represent total airway resistance (R). Fig c-d represent tissue damping (G). Fig e-f represent dynamic pulmonary compliance (C). Fig a, c, and e represent the baseline measurements for R, G, and C. Fig b, d, and f represent the measurements obtained at 50mg/mL methacholine dosage for R, G, and C. Asterisks indicate p< 0.05 by two-tailed unpaired Student T-test; uninfected (n ranges 7–6), HDM (n = 4).

