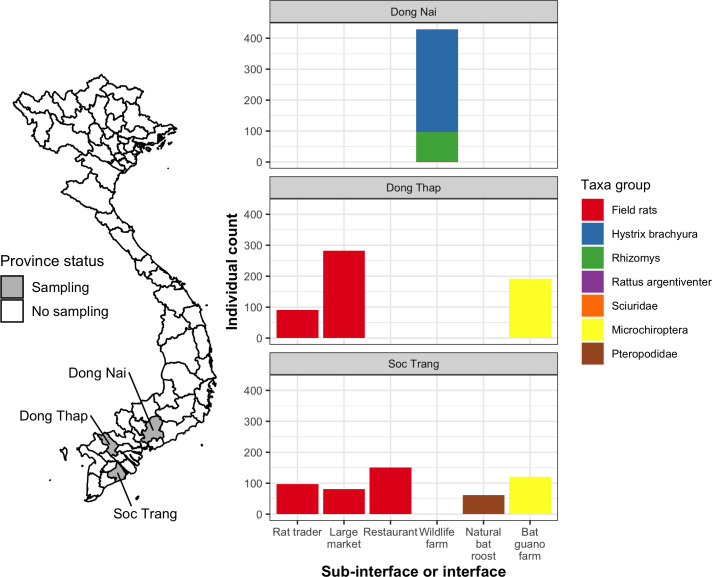
Fig 4. Map of sampling sites by province and multi-panel plots showing individual counts of animals sampled by province, taxa, and sub-interface (rat trade) or interface.
The color of each bar represents the animal taxonomic group sampled in Dong Nai, Dong Thap, and Soc Trang provinces. Sciuridae and Rattus argentiventer were only sampled one time apiece from wildlife farms. Map was made using geoBoundaries v. 3.0.0 (https://www.geoboundaries.org; [34]) and Open Development Mekong (https://vietnam.opendevelopmentmekong.net) data under a CC BY 4.0 license.

