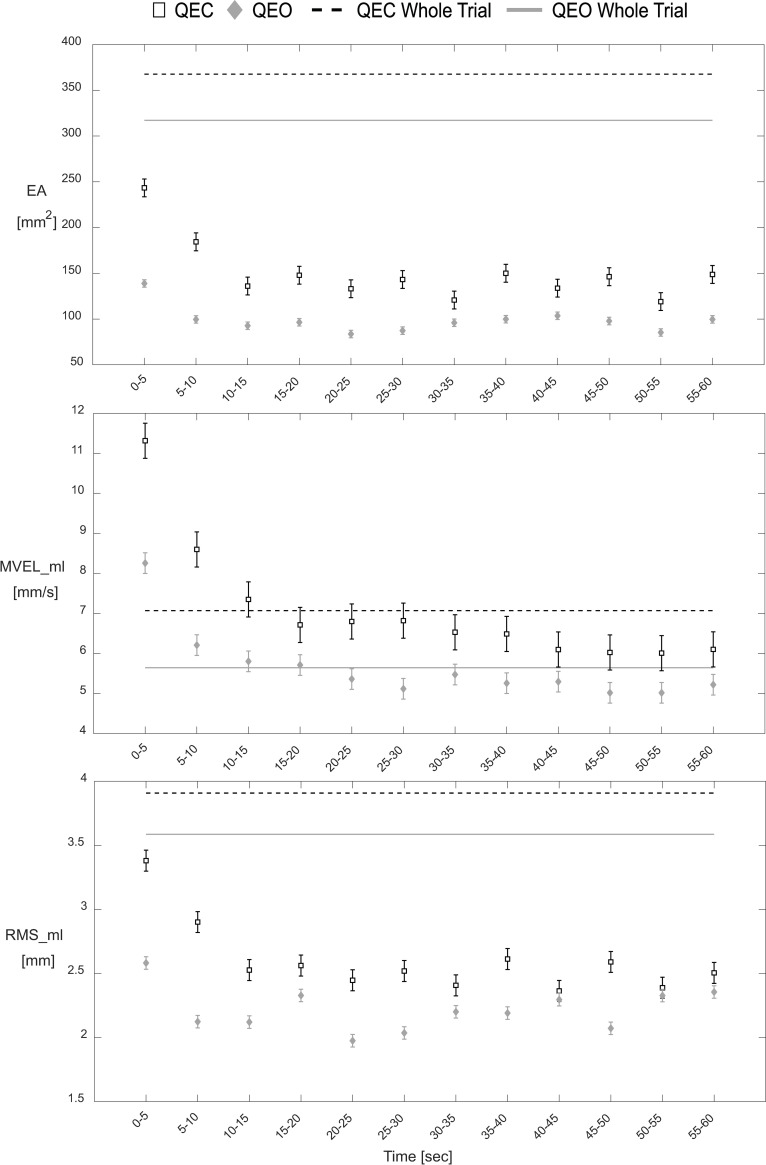
Fig 4. Whole-trial estimates vs epoch-based estimates for each CoP parameter in QEC and QEO stance.
Hollow squares and gray diamonds represent the time-series data for QEC stance and QEO stance, respectively. Dashed black lines and solid gray lines represent the whole-trial estimates for QEC stance and QEO stance, respectively. Values correspond to mean ± standard error for each epoch.

