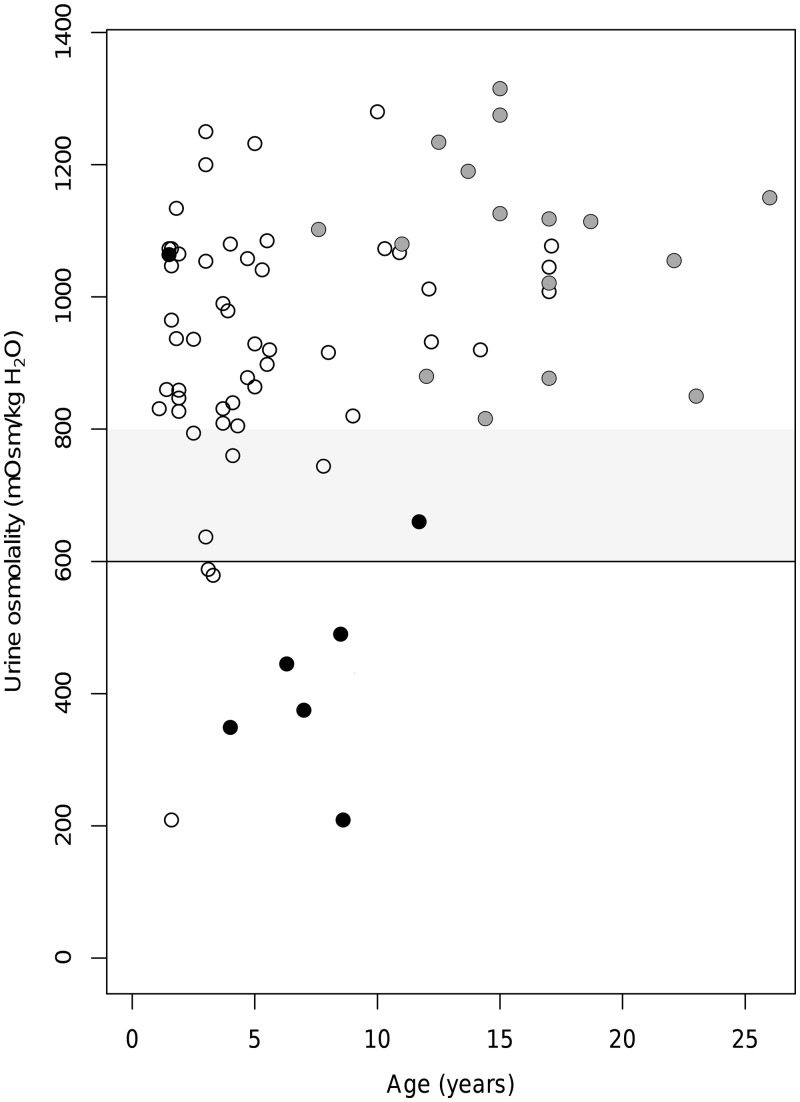
FIGURE 3.
Assessment of urine osmolality and evolution of renal function. For each patient, urine osmolality at first examination was plotted against age. Normality values are set at or >600 mOsm/kg H2O (black line). The grey zone between 600 and 800 mOsm/kg H2O defines borderline values. Only subjects with normal eGFR at first examination were included. Grey circles represent patients with NRF who were ≥18 years at time of last examination. Black circles represent patients with normal, borderline or abnormal urinary osmolality at first examination who later developed overt renal insufficiency with abnormal eGFR (CKD2–CKD5). White circles represent patients with NRF who were still <18 years at time of last examination.

