Fig. 3.
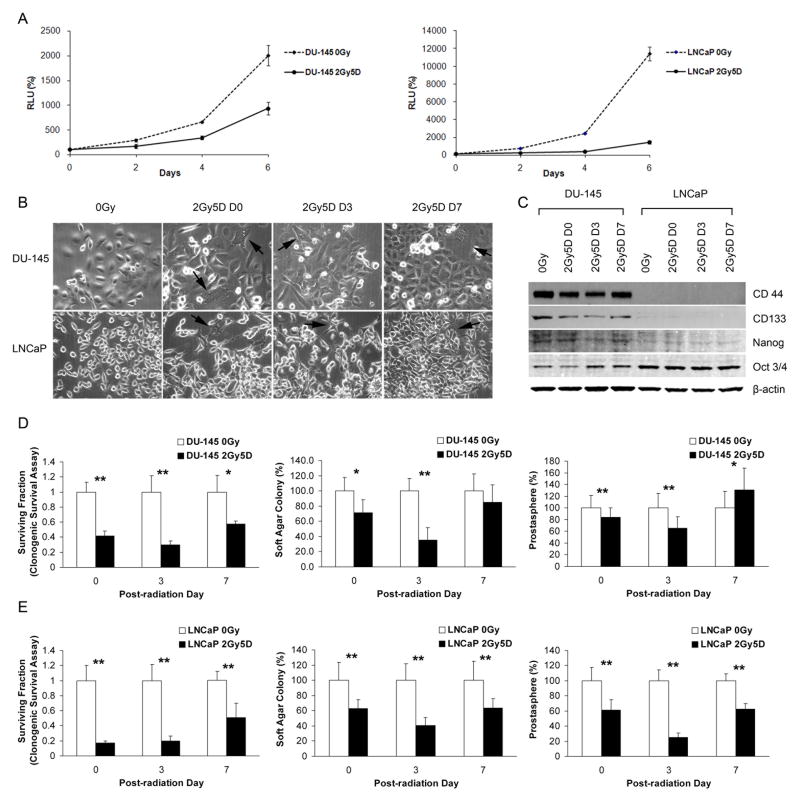
CSC properties of PC cell lines shortly after irradiation with daily 2 Gy doses for 5 days (2Gy5D). (A) Growth rates following irradiation, normalized to day 0. Bars represent means ± SDs. (B) Phase-contrast images of radioresistant DU-145 and LNCaP cultures, photographed on the indicated days. Large, elongated or stellate, multinucleated cells are noted (arrows). (Original magnification: x200) (C) Western blot analyses of CD44, CD133, Nanog, and Oct 4. (D and E) Clonogenic survival (left column), soft-agar (middle column), and prostatosphere (right column) assays were performed using irradiated DU-145 (D) and LNCaP (E) cells. All values are normalized to non-irradiated controls (0 Gy). Bars represent means ± SDs (*p < 0.05; **p < 0.001).

