. 2020 Aug 6;2(8):e0175. doi: 10.1097/CCE.0000000000000175
Copyright © 2020 The Authors. Published by Wolters Kluwer Health, Inc. on behalf of the Society of Critical Care Medicine.
This is an open-access article distributed under the terms of the Creative Commons Attribution-Non Commercial-No Derivatives License 4.0 (CCBY-NC-ND), where it is permissible to download and share the work provided it is properly cited. The work cannot be changed in any way or used commercially without permission from the journal.
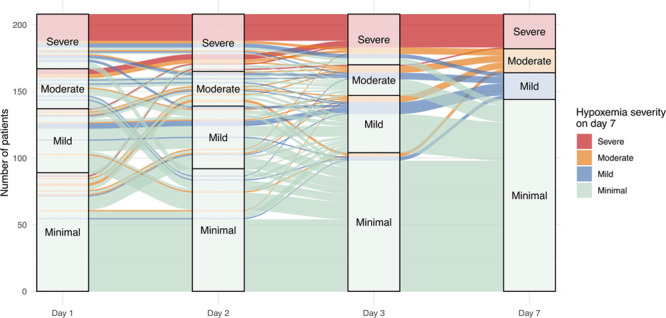
Figure 4.

Alluvial plot showing the hypoxemia severity evolution between admission and day 7.
