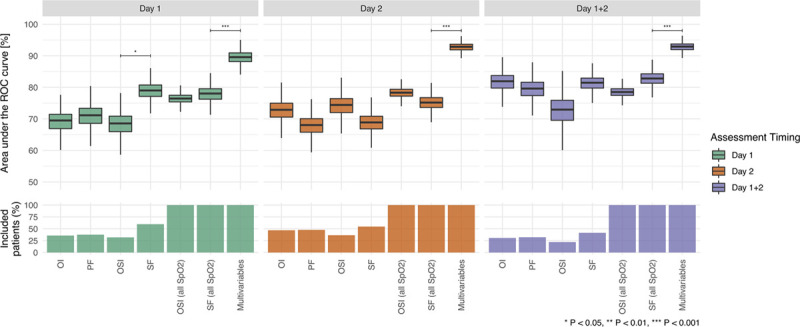
Figure 5.

Random forests empirical distributions of the area under the receiver operating characteristic (ROC) curve obtained after Monte Carlo simulation using common hypoxemia markers and multivariable models. Boxplot indicate the median value, interquartile range, and 95% CI. OI = oxygenation index, OSI = oxygenation saturation index, PF = Pao2/Fio2, SF = pulse oximetric saturation/Fio2.
