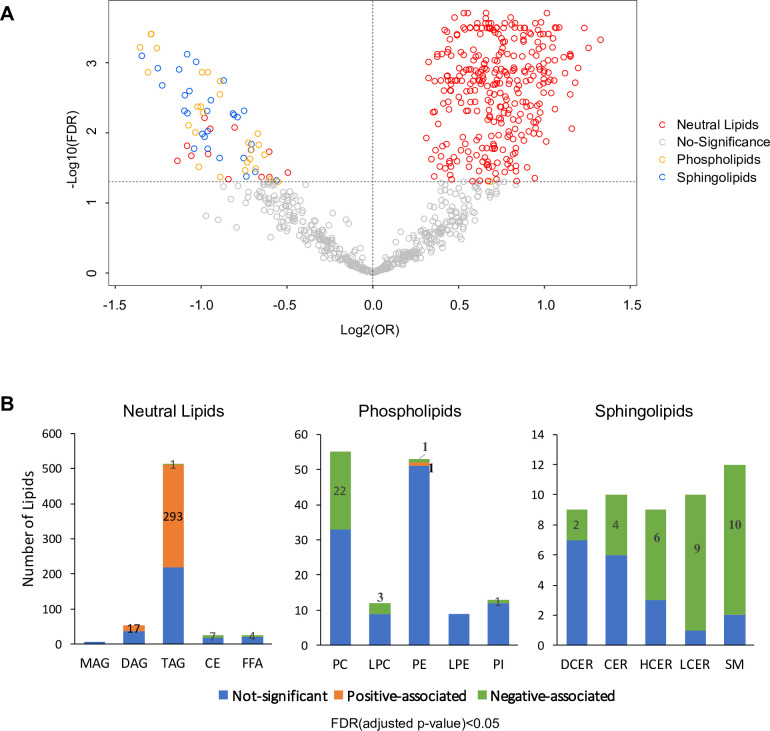
Figure 2. Overview of T2D associated lipids.
(A) Volcano plot showed -log10(FDR) against log2(OR) of 816 lipid species in the association with T2D risk. Grey circles were denoted as no significant association with T2D risk. Of those that are significantly associated, red circles denote as neutral lipids, orange as phospholipids, blue as sphingolipids. (B) Number of T2D positive-, negative- and non- associated lipids in each lipid class were shown. Orange, green and blue bars denote positive-, negative- and non- associated lipids respectively. Significance was indicated by FDR < 0.05.


