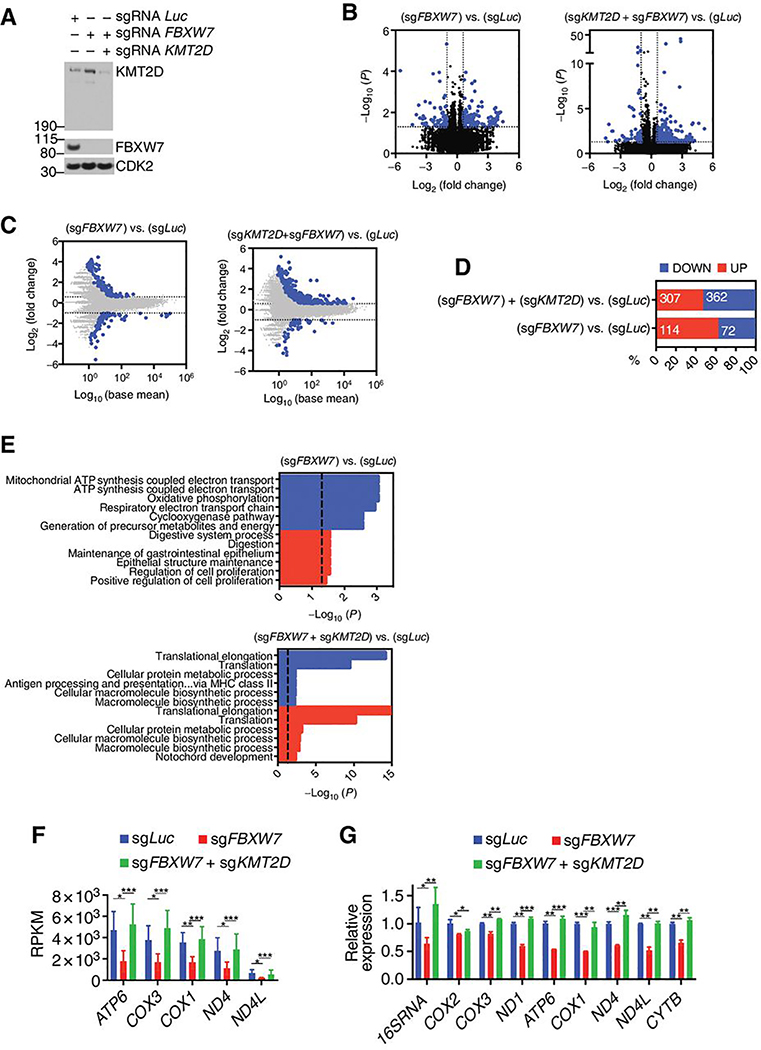
Figure 6. The FBXW7-KMT2D degradation axis regulates genes of the oxidative phosphorylation pathway.
A, Immunoblot for the indicated proteins from OPM-1 cells expressing the indicated sgRNAs. B, Volcano plot showing differentially expressed genes (DEGs) in for cells showed in (a) (n = 3, DeSeq2). Shown in blue are the mRNAs with at least 50% fold change increases or decreases with a p-value ≤ 0.05. C, Fold-change plot of gene expression levels for the cells shown in (a) (n = 3, DeSeq2). Shown in blue are mRNAs with at least 50% fold change increase or decrease. D, Proportion of significant upregulated or downregulated genes from (b). E, Gene ontology (GO) analysis of the upregulated or downregulated genes from (d). Dashed line indicates −log10(P)= 1.301, corresponding to p-value=0.05. F, Reads Per Kilobase per Million mapped reads (RPKM) values for indicated genes (n=3; mean ± SD, Deseq2 test; *p<0.05, **p<0.01, ***p<0.001).. G, Relative mRNA expression levels for indicated genes analyzed by qPCR, (n=3; mean ± SD, two-tailed Student’s t-test; *p<0.05, **p<0.01, ***p<0.001).

