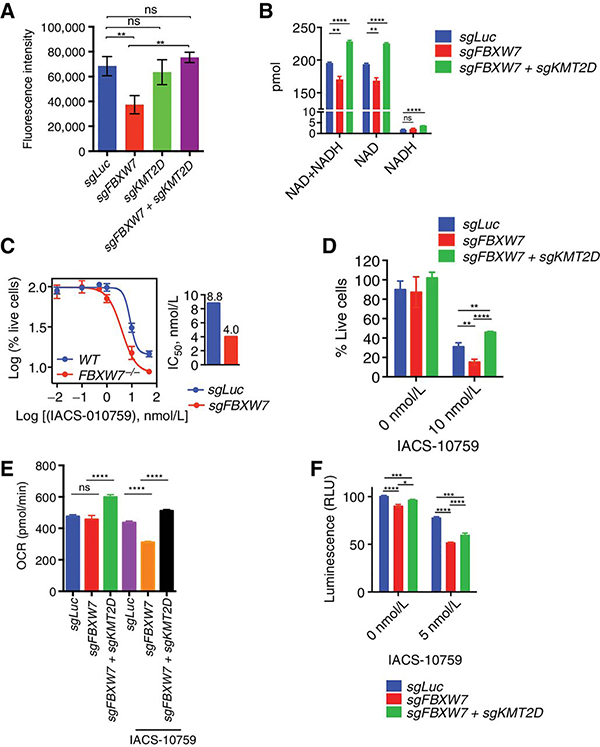
Figure 7. FBXW7 promotes OxPhos in DLBLC.
A, Fluorescence intensity for U2932 cells expressing the indicated sgRNAs and stained with 50 nM MitoTracker Deep Red FM dye for the 30min (n=3, mean ± SD, one-way ANOVA; (**p<0.001, ns=not-significant). B, Total NAD+ and NADH levels were determined in U2932 cells expressing the indicated sgRNAs. (n=3; mean ± SD, two-tailed Student’s t-test; **p<0.01, ****p<0.0001). C, U2932 cells expressing the indicated sgRNAs were treated for 4 days with the indicated concentrations of IACS-010759. Live cell numbers were plotted (n=3, mean ± SD). IC50 is shown in the bar graph. D, U2932 cells expressing the indicated sgRNAs were treated for 4 days with DMSO or 10 nM IACS-010759. Live cell numbers were plotted (n=3; mean ± SD,two-tailed Student’s t-test; **p<0.01, ****p<0.0001 ). E, Oxygen consumption rates (OCR) of U2932 expressing the indicated sgRNAs pretreated with DMSO or with 15 nM IACS-010759. Measurements were taken using the Seahorse XFe96 Analyzer (n=6; mean ± SD; two-tailed Student’s t-test; ****p<0.0001, ns=not-significant). F, Quantification of ATP levels in U2932 cells expressing the indicated sgRNAs. Cells were treated with DMSO or 5 nM IACS-010759 for 16h (n=3; mean ± SD; two-tailed Student’s t-test; *p<0.05, ***p<0.001, ****p<0.0001).

