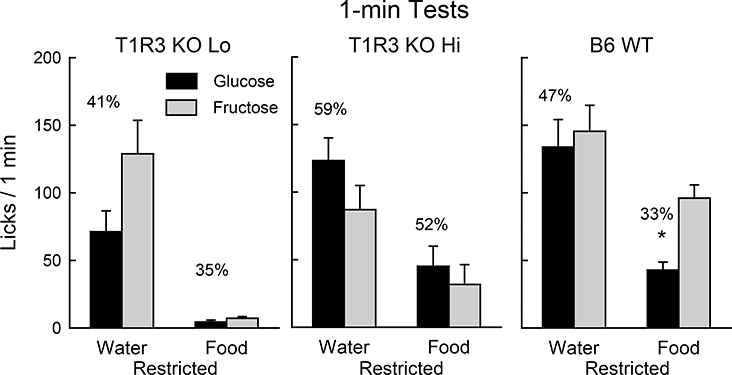
Figure 4.
Experiment 2. Mean (+SE) 8% glucose and 8% fructose licks during 1-min two-bottle tests conducted under water- or food-restriction for T1R3 KO Lo (n=18), T1R3 KO Hi (n=14) and B6 WT (n=24) mice. The mice had no prior experience with sugars. Numbers atop bars represent the mean percent preference for that sugar. Significant (P < 0.05) within group differences in glucose and fructose licks indicated by *.

