
FIGURE 4.
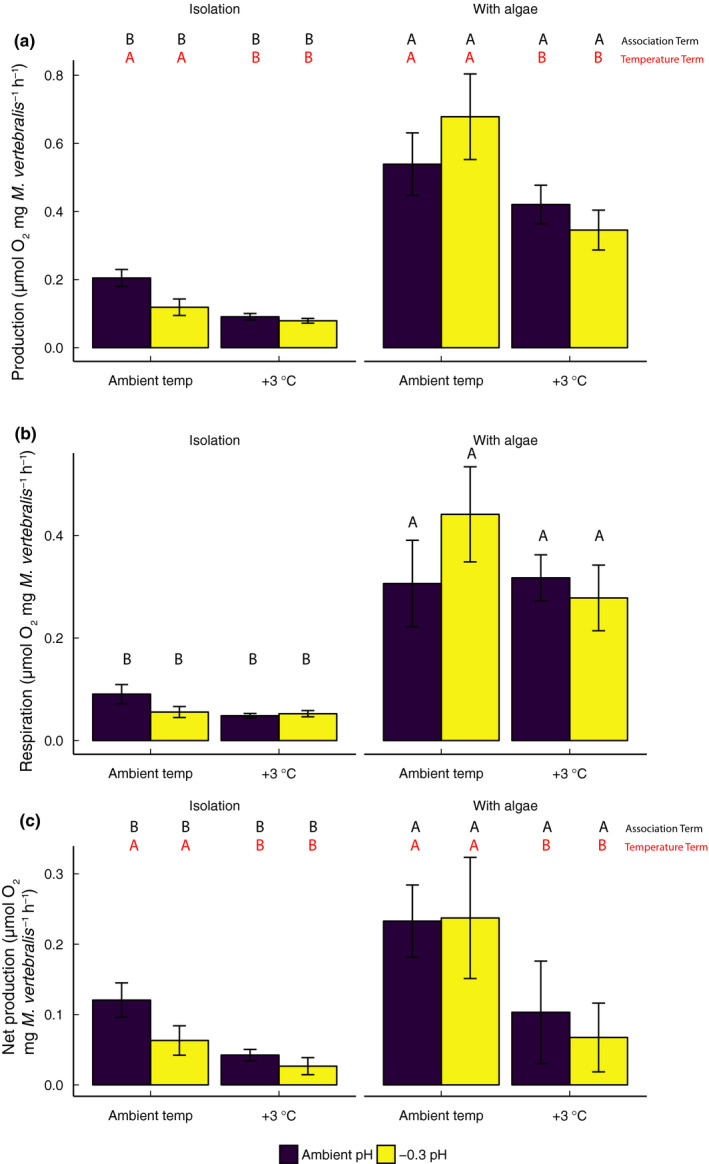
Oxygen flux determined for Marginopora vertebralis at the end of the 2‐week experiment in isolation and in association with Laurencia intricata. (a) Total production (proxy for photosynthesis) in light (~100 µmol photon m−2 s−1), (b) respiration (measured in the dark), and (c) net production (the difference between light and dark oxygen fluxes) were measured. All results are expressed as mean ± SE, n = 10. Differing letters indicate significance using Tukey HSD post hoc analyses