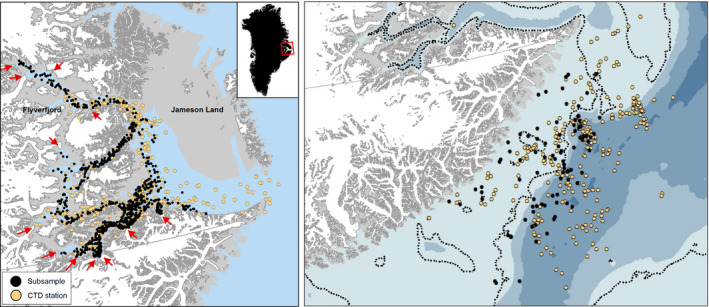
FIGURE 1.

Left: The Scoresby Sound fjord complex with active glaciers (red arrows) and positions from 12 narwhals in Scoresby Sound (black dots). The positions were downsampled to 10 positions per day, which again was resampled to 1,000 positions. Positions of CTD profiles collected by four whales in August–September 2017 and 2018 are shown below the black dots as yellow dots (drawn below the black dots). An inset shows the study area in East Greenland. Right: Winter (December through March) positions of whales (black dots) and positions of CTD casts (yellow dots). Dotted line shows the 300 m depth contour
