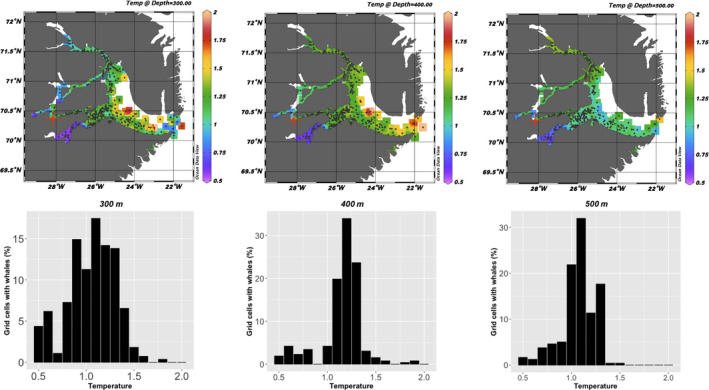
FIGURE 3.

Temperature at depth at the locations (grid cells) selected by the whales during summer (August–September). The upper panel shows the isosurface distribution of temperatures at 300 m, 400 m, and 500 m depth which are the depth categories that are most targeted by the whales. Black dots show the positions of the CTD casts. The lower panel shows the percentage grid cells that were selected by the whales with the associated mean temperature in the grid cells
