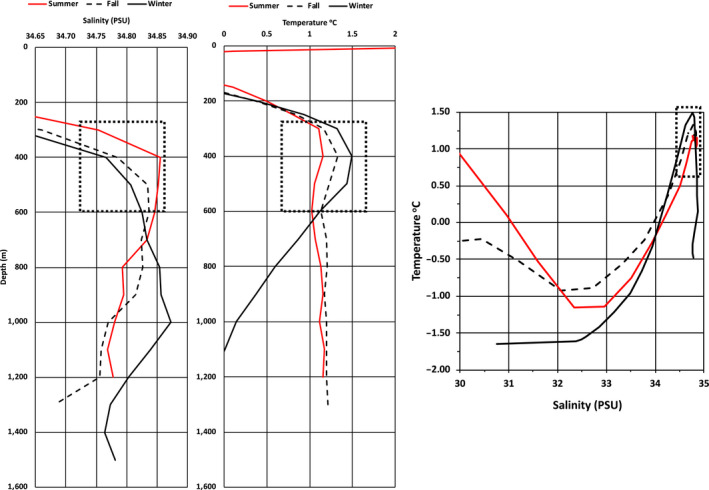
FIGURE 4.

Average salinity and temperature profiles measured by the narwhals during summer, fall, and winter 2017–2018 (left) and the temperature–salinity (PSU = practical salinity unit) diagram for the three seasons (right). The square boxes indicate the T‐S regimes that were targeted by the whale's diving and buzzing activity
