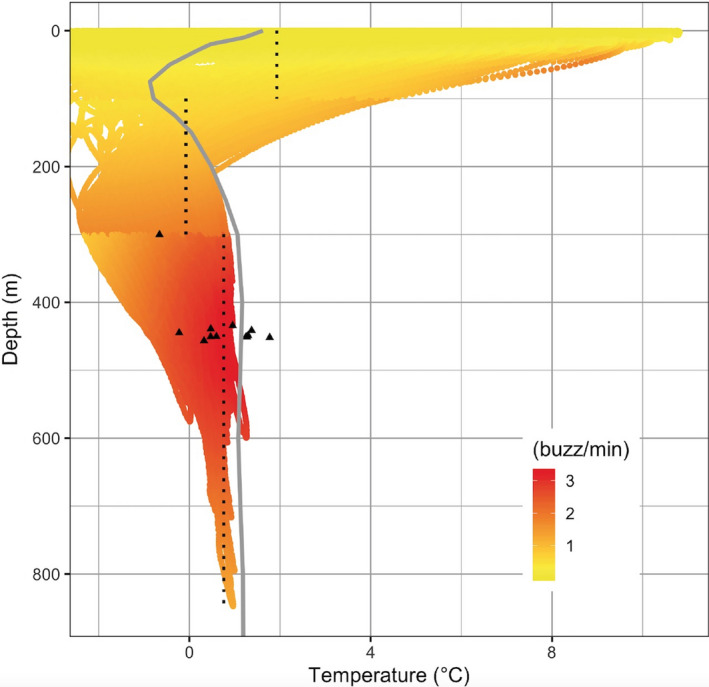
FIGURE 6.

Predicted buzz rates (buzz/min) (22,519 buzzes) in relation to depth and temperature from generalized mixed‐effects model. The average temperature profile from the CTD casts is shown as the gray line. The black dotted lines mark the population estimates for the temperature with the highest predicted buzzing rates in each of the three depth categories. The estimates were 0–100 m: 1.9°C, 100–300 m −0.1°C, and >300 m: 0.7°C. The black triangles mark the individual specific estimates for the highest predicted buzzing rates (see Table 2 for details). Seven out of 12 whales selected temperatures that were lower than the average temperature. Extreme values below −2°C were omitted (<2% of the values). The number of buzzes for the three intervals is 0–100 m: 1.5 buzzes/1000 s, 100–300 m: 24.5 buzzes/1000 s, and >300 m: 47 buzzes/1,000 s. Extreme values below −2°C were omitted (<2% of the values)
