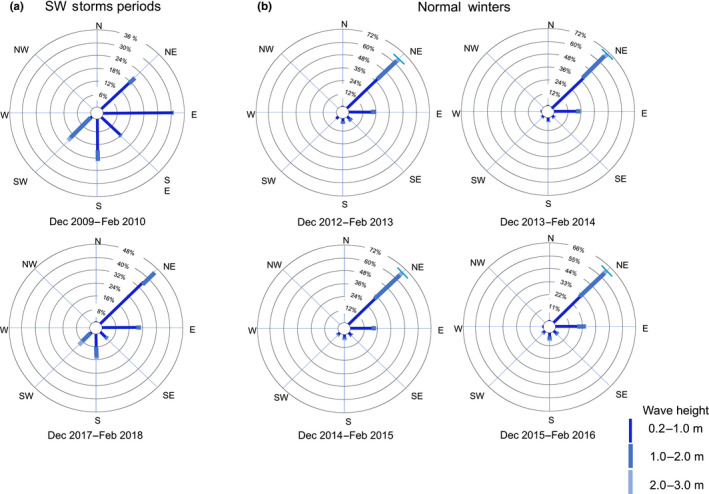
FIGURE 3.

(a) Compass rose showing average wave height and direction from the buoy data for the two winter storm periods: December 2009–February 2010 and December 2017–February 2018. These storm periods were characterized by southwesterly and southern waves with heights of 1–2 and 2–3 m. (b) Compass rose showing average wave height and direction from the buoy data for the winter periods of 2012, 2013, 2014, and 2015. These years were normal and not characterized by winter storms. Most of the days during these study periods were characterized by 0.2–1 m and 1–2 m northeasterly and eastern waves
