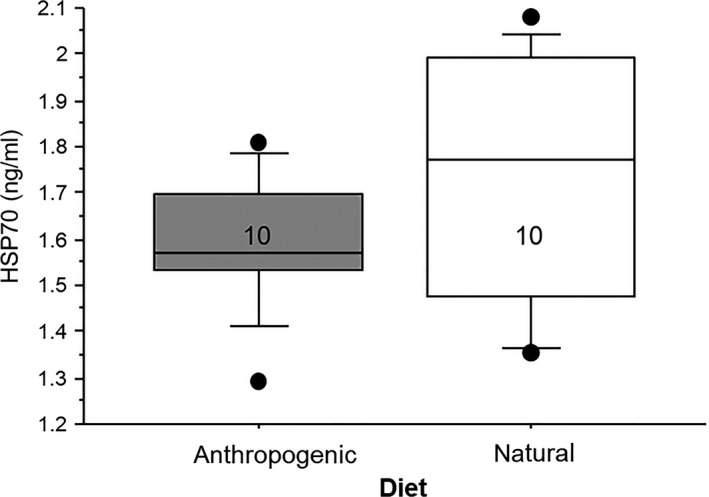
FIGURE 3.

Box plots showing the relationship between experimental diet and concentrations of heat shock protein 70 (HSP70, ng/ml) in blood. There was no significant influence of diet on this measure. Numbers in the boxes indicate sample sizes. For these box plots, the boxes show the 25th and 75th percentile values, the line within shows the median value, and the whiskers show the minimum and maximum of the dataset, with additional data points showing potential outliers in the dataset
