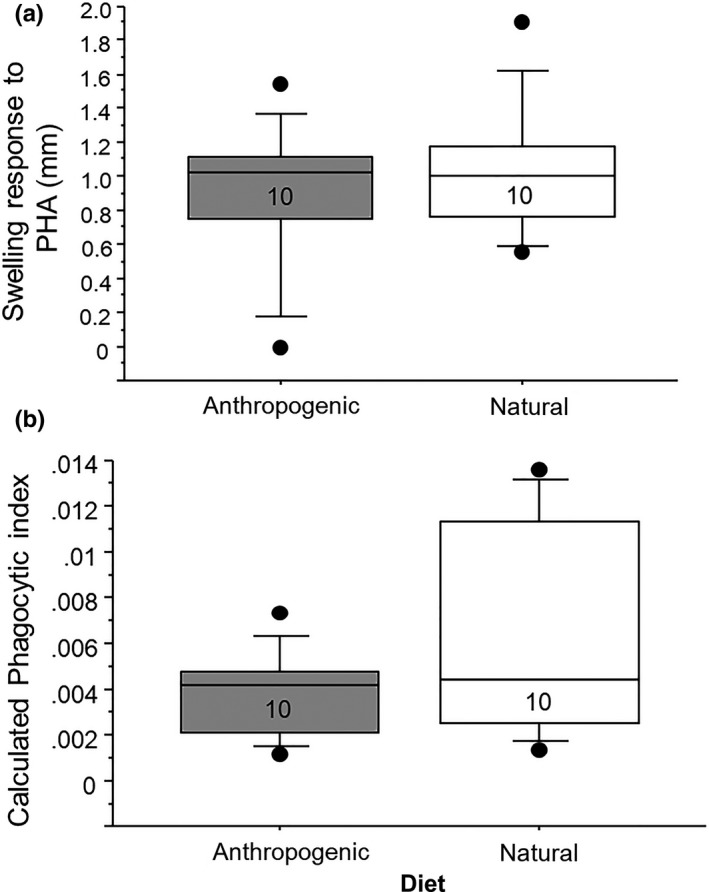
FIGURE 5.

Relationships between dietary treatment and (a) swelling response (mm) against phytohemagglutinin (PHA, measured 38 days after initiation of experimental diets) and (b) the ability of the blood to clear carbon particles via phagocytosis (presented as calculated phagocytic index, the change in optical density readings over time). There was no effect of diet on either of these measures. Numbers in the boxes indicate sample sizes. For these box plots, the boxes show the 25th and 75th percentile values, the line within shows the median value, and the whiskers show the minimum and maximum of the dataset, with additional data points showing potential outliers in the dataset
