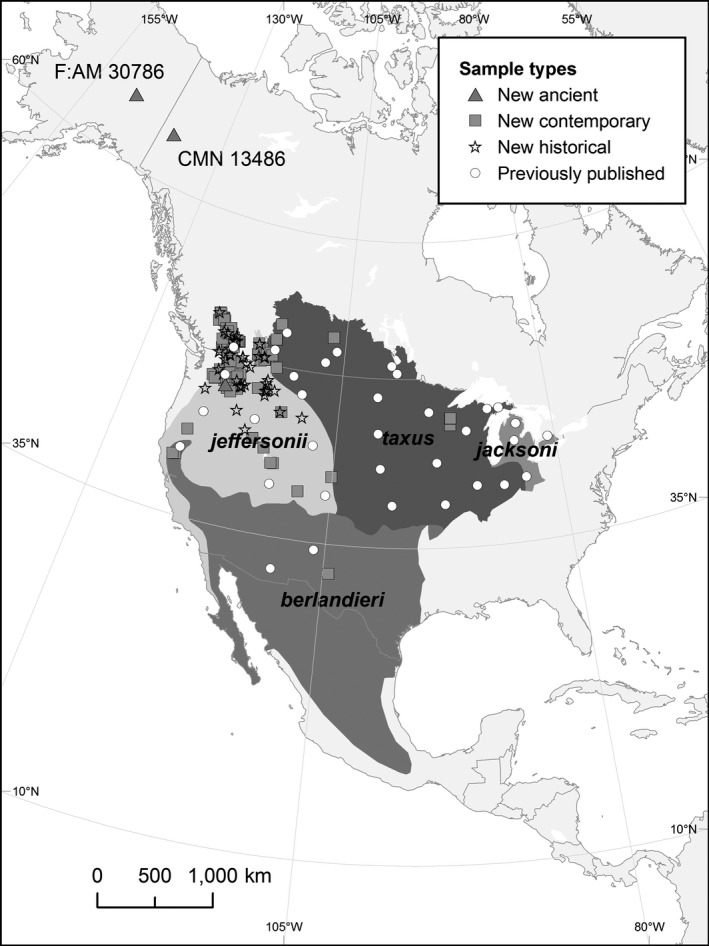
FIGURE 1.

Sample distribution map of American badgers used in the current study. Subspecies boundaries are shaded, and sample type is represented by different symbols defined in the inset. Previously published samples are plotted as a single point representing sampling units
