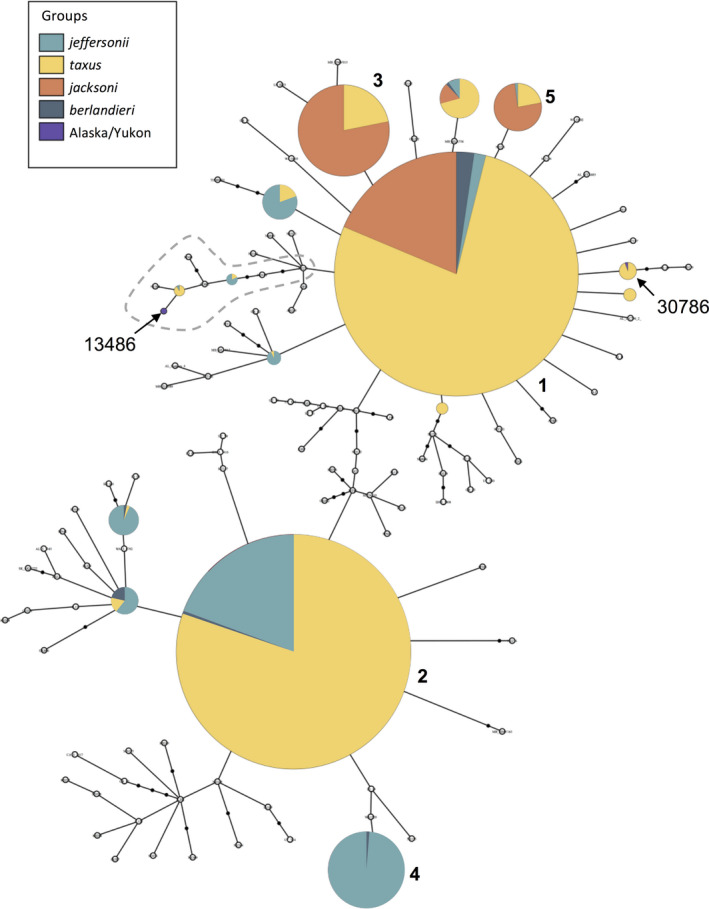
FIGURE 3.

Haplotype network based on a fragment of the mtDNA D‐loop from American badger sampling units across the species' range. Each circle represents a unique haplotype, with the size corresponding to the relative number of individuals with each haplotype. Colors designate the four current subspecies designations in relation to sampling units in the Pacific Northwest [T. t. jeffersonii] and eastern Beringia (Alaska/Yukon). Open circles represent haplotypes with 10 or fewer individuals. Closed, black circles represent unsampled transitions between recovered haplotypes. The most common haplotypes are numbered 1–5. Haplotypes recovered from ancient specimens are labeled with museum identification numbers. Sequences with a 26‐basepair indel are highlighted by the gray dashed line
