FIGURE 4.

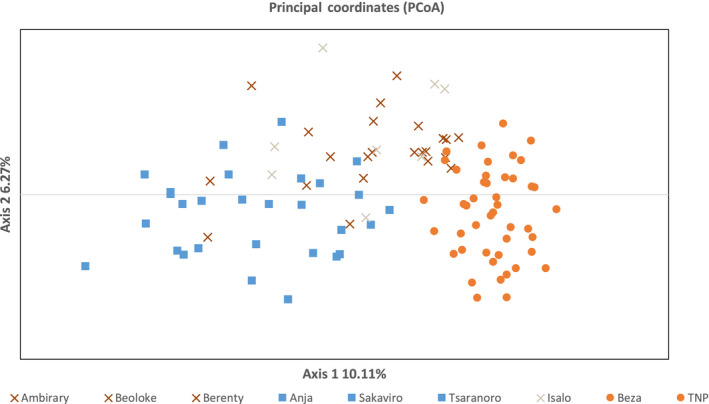
Principal coordinate analysis (PCoA). Data points are color coded according to DAPC analysis (orange: west; beige: central; blue: North; brown: South) while marker shapes correspond to STRUCTURE analysis (•: Western; □: North; x: South)

Principal coordinate analysis (PCoA). Data points are color coded according to DAPC analysis (orange: west; beige: central; blue: North; brown: South) while marker shapes correspond to STRUCTURE analysis (•: Western; □: North; x: South)